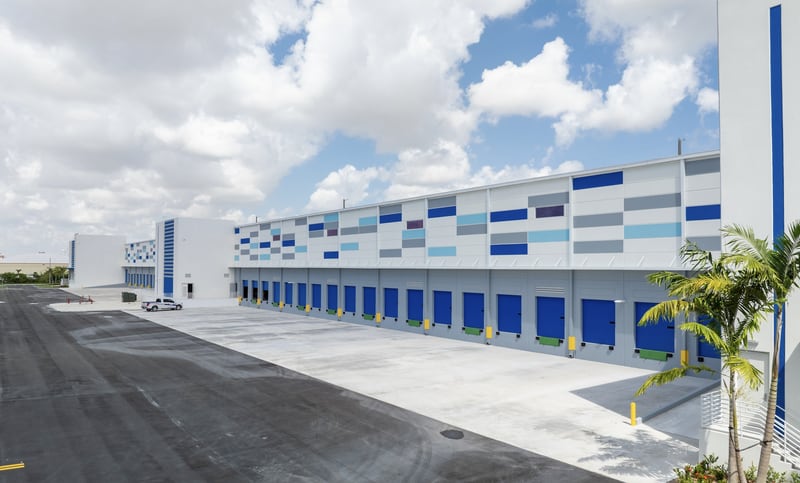
Summary
In May 2025 the U.S. refrigerated warehouse sector was described, by MMCG and by most of the industry, as chronically undersupplied. That description no longer holds. National cold storage vacancy reached 7.7% in mid-2026, the highest reading in more than 20 years, after the first negative first-half absorption since 2007.
51 minute read.
In May 2025 the U.S. refrigerated warehouse sector was described, by MMCG and by most of the industry, as chronically undersupplied. That description no longer holds. National cold storage vacancy reached 7.7% in mid-2026, the highest reading in more than 20 years, after the first negative first-half absorption since 2007. The two listed operators have called a bottom in occupancy but not a recovery in pricing. The largest portfolio trade of 2026 cleared at a 7.0% capitalization rate, roughly 100 basis points wider than the late-2023 benchmark. Underneath the headline, the market has split in two: buildings delivered between 2006 and 2019 are effectively full, while pre-1990 stock and still-leasing 2020s deliveries each carry availability near 12%. This edition replaces the 2025 analysis, re-tests every figure it carried, and sets out what the reset means for lenders, developers and investors underwriting cold storage in 2027.
Executive Summary
The U.S. cold storage market has moved from scarcity to surplus in a single cycle. The supply response to the 2020 to 2022 demand surge, more than 24 million SF completed between 2023 and 2025 with 2025 the record year, arrived as customer inventories normalized, frozen food unit volumes flattened, and trade policy began moving protein stocks in both directions. Lineage, the largest operator, told investors in February 2026 that public refrigerated warehouse supply grew 14.5% between 2021 and 2025 while consumer demand grew about 5%, an excess of roughly 10%. Newmark's semi-annual survey put national vacancy at 4.4% in the first quarter of 2024, 6.9% at the end of 2025 and 7.7% at mid-2026.
MMCG's own census of the national inventory, built from a property-level review of 2,834 existing refrigerated and cold storage buildings totaling 318.9 million SF across all 50 states, confirms the broker series from a different angle. As of October 2026, 28.3 million SF, or 8.9% of that inventory, is marketed as available. The availability is not evenly distributed. Buildings completed between 2010 and 2019 show 2.5% availability. Buildings completed before 1990, which still make up 43% of the national square footage, show 11.6% to 12.0%. Buildings completed since 2020, 39.3 million SF of the newest and tallest product in the country, also show 12.0%, because they are still in lease-up against a market that has stopped absorbing space at the 2021 pace.
The capital markets have repriced accordingly. Lineage trades at about $34 against a $78 IPO price. Americold recorded a $309.6 million impairment in the second quarter of 2026, contributed 12 facilities to a joint venture with EQT at a 7.0% cap rate and about $3,300 per pallet position, and is marketing 15 idled sites. Both companies are net sellers of real estate into the private market. The spread between cold storage and general industrial yields, which the 2025 edition put at roughly 40 basis points on an appraisal basis, is wider and, by most transaction evidence, has always been wider than that index implied.
The operating environment has shifted from regulatory pressure to cost pressure. EPA's May 2026 rule gives new cold storage systems an interim 700 GWP refrigerant limit until 2032, and the FSMA 204 traceability deadline is deferred to July 2028. Industrial electricity, by contrast, rose 6.0% nationally in 2025 and 6.8% in the first five months of 2026, with Illinois up 14.8% in a single year. Power is now the second-largest operating cost at the national operators after labor, and it is the line item that moved same-store margins in 2026.
The industry's long-term case is intact. Food consumption does not fall, the online grocery channel is still gaining share, pharmaceutical cold chain demand is compounding at 8% to 10% a year, and the physical stock of U.S. cold storage is old: the median building in the MMCG census was built in 1985 and has a 24-foot clear height. What has changed is the timing and the risk profile. The sector is in a cyclical reset that will take through 2027 to clear, the clearing will happen asset by asset rather than market-wide, and the rewards will go to modern, well-located, pre-committed buildings while legacy stock absorbs most of the vacancy. The remainder of this report sets out the evidence, the geography, the demand picture, the capital markets and the underwriting parameters MMCG now applies to cold storage feasibility work.
What Changed Since the 2025 Edition
MMCG's May 2025 analysis, updated in March 2026, described the sector as a supply-constrained niche with vacancy near 3.4%, build costs of $250 to $350 per SF, cap rates around 6% and a yield spread to general industrial of about 40 basis points. Each of those figures was defensible when written. Each is now wrong, and the direction of the error matters more than its size.
The vacancy figure is the clearest case. The 3.4% carried in the earlier edition matches Newmark's current reading for buildings constructed between 2006 and 2019 only. The national rate was already 4.4% in the first quarter of 2024 and has risen every half-year since. The construction cost range described freezer and multi-temperature product, not the sector; Newmark's current blended range is $130 to $350 per SF against $85 to $150 for dry warehouse, with contractor indications of roughly $150 to $250 for cooler, $200 to $350 for freezer and $380 or more for automated high-bay. The 6% cap rate was a late-2023 market average that predated the Lineage IPO's collapse and the 2026 repricing; the best current transactional anchor is 7.0%. The 40-basis-point spread came from the NCREIF appraisal universe; transaction-based indices showed a 225 to 250 basis point spread over the same period, so the earlier edition quoted the most optimistic measure available.
The revenue and establishment figures have also moved. IBISWorld's June 2026 edition puts NAICS 493120 revenue at $8.8 billion for 2026, up 2.1% on the year but implying about $8.6 billion for 2025 rather than the $9.05 billion carried previously, with a five-year compound growth rate of 0.6% rather than 3.1%. The same edition counts 2,816 businesses, not 3,053, and about 69,000 employees, not 63,000. Federal productivity data show industry employment flat in 2025 after a 0.8% decline in 2024. The $40 billion to $50 billion "U.S. cold storage market" figures circulated by syndicated research publishers measure a different universe, roughly five times the Census-defined industry, and their double-digit growth forecasts are contradicted by every operating and occupancy series available. MMCG does not use them.
The market share figures carried for Lineage (about 31%) and Americold (about 23%) cannot be verified against any current primary source. The last company-disclosed figures date from 2020 and were lower. Both companies have since shed capacity, and this edition treats them as the dominant price-setters in overlapping markets without assigning a national share.
The one figure the earlier edition understated was geographic concentration in Georgia. USDA's biennial capacity census, released in February 2026, shows Georgia's gross refrigerated capacity up 76% in two years, from 172 million to 304 million cubic feet, moving the state from eighth place to second nationally. That single state accounted for 45% of the national net capacity gain between October 2023 and October 2025.
Industry Size and the Capacity Paradox
Three different measurement systems describe the U.S. cold storage industry, and the 2025 edition mixed them. This edition keeps them separate.
The Census-defined industry, NAICS 493120, Refrigerated Warehousing and Storage, generated an estimated $8.8 billion of revenue in 2026 across 2,816 businesses employing about 69,000 people. Profit margins improved from 5.8% in 2021 to 8.3% in 2026 as operators repriced contracts during the 2022 to 2023 shortage, and that margin is now under pressure as pricing power fades. Employment has stopped growing. The industry is mature, low-growth and increasingly consolidated.
The federal capacity census is narrower and more precise. USDA's National Agricultural Statistics Service surveys refrigerated warehouses that store food at or below 50 degrees Fahrenheit for 30 days or more. Its February 2026 release, with an October 1, 2025 reference date, counted 3.99 billion gross cubic feet across 931 warehouses, up 7.9% from 3.70 billion cubic feet in October 2023. Usable capacity was 3.25 billion cubic feet, of which 79% was freezer and 21% cooler.
The composition of that growth is the single most important structural fact in this report. Public, third-party refrigerated capacity fell 2.3%, from 2.51 billion to 2.46 billion cubic feet, and has fallen in every survey since 2017, when it stood at 2.83 billion. Private and semi-private capacity, owned and operated by food producers, retailers and distributors for their own goods, rose 29.6%, from 1.18 billion to 1.53 billion cubic feet. The public share of national refrigerated capacity dropped from 68% to 62% in two years. All of the net growth in U.S. cold storage capacity between 2023 and 2025 came from owner-operated space. The customer base that third-party operators serve is building its own warehouses.
The real estate inventory is larger than the USDA count because it includes distribution, e-grocery, pharmaceutical and multi-temperature buildings that fall outside the food-commodity survey. Newmark's mid-2026 overview puts U.S. cold storage inventory at 346 million SF, or 1.9% of the national industrial base. MMCG's census, which covers every building in the national property database carrying the refrigeration or cold storage classification, counts 2,834 existing buildings and 318.9 million SF. The two figures bracket the same universe; the difference reflects classification choices at the margin. The 625 million SF figure carried in the 2025 edition was a broader food-processing-and-refrigeration count and should not be used as leasable cold storage inventory.
The MMCG census describes a physically old and highly fragmented stock. The median building is 55,000 SF; the mean is 112,500 SF. Buildings of 200,000 SF or more number 524 (18% of the count) but hold 59.5% of the square footage. Buildings under 50,000 SF number 1,344 (47% of the count) and hold 8.1%. Half of all buildings are rated Class C. Only 310 buildings, holding 26.7% of national square footage, are rated Class A. The median year built is 1985 by count and 1993 weighted by square footage. Buildings completed before 1990 represent 57.9% of the count and 43.2% of the square footage. Buildings completed before 2006 represent 83% of the count and 70.8% of the square footage.
Clear height tells the same story in a way that matters directly for pallet economics. Across the 1,572 census buildings with recorded clear heights, the median is 24 feet. Buildings under 24 feet are 46% of the count. Buildings at 40 feet or more are 8% of the count and 18% of the square footage. The median clear height rises steadily by vintage: 18 feet for pre-1970 buildings, 23 feet for the 1970s and 1980s, 26 feet for 1990 to 2005, 32 feet for 2006 to 2019, and 40 feet for buildings completed since 2020. A 2020s freezer stores 70% to 120% more pallets per square foot than a pre-1990 freezer, with lower energy use per pallet. That productivity gap, more than any demand figure, explains why the market is clearing the way it is.
Real Estate Fundamentals: Record Vacancy, Negative Absorption, a Collapsing Pipeline
Newmark's national series, the only continuous broker measure of cold storage vacancy, rose from 4.4% in the first quarter of 2024 to about 6.9% at year-end 2025 and 7.7% at the end of the second quarter of 2026. The mid-2026 reading reflects approximately 56 million cubic feet of move-outs against 41 million cubic feet of deliveries, the first negative first-half net absorption Newmark has recorded since 2007. Annual net absorption fell from 4.8 million SF in 2021 to 4.2 million SF in 2024 and 3.5 million SF in 2025, while 2025 deliveries set a record at roughly 10 million SF.
The vacancy increase is concentrated in two cohorts. Buildings constructed before 2006 were 8.2% vacant at mid-2026 and held 68% of all vacant cubic feet. Buildings constructed in 2020 or later were 10.9% vacant and still leasing up. Buildings constructed between 2006 and 2019 were 3.4% vacant, which is effectively full once frictional space is allowed for. In 2025, Newmark recorded positive absorption of about 8.2 million SF in modern facilities against negative absorption of about 3.9 million SF in legacy buildings. The market is not weak; it is sorting.
The MMCG census shows the same sorting at the property level. Across 318.9 million SF of existing inventory, 28.3 million SF (8.9%) is marketed as available in 318 buildings. Availability by decade of construction runs 11.5% for pre-1980 buildings, 12.2% for the 1980s, 6.2% for the 1990s, 7.6% for the 2000s, 2.5% for the 2010s and 12.0% for buildings completed since 2020. Buildings completed before 2006 account for 72.6% of all available space. The 2010 to 2019 cohort, 37.4 million SF of modern conventional and early-automated freezer and cooler space, is the tightest segment of the U.S. industrial market by a wide margin.
The lease-up problem in new product is visible in the census delivery data. Buildings completed in 2024 (6.65 million SF) show no remaining availability. Buildings completed in 2025 (8.80 million SF) show 23.3% available, and the 1.96 million SF completed so far in 2026 shows 21.2%. Newmark reports that projects under construction average nearly 300,000 SF against an average lease since 2020 of about 125,000 SF, which means a typical speculative delivery needs two to three tenants to stabilize in a market where customers are signing 12-to-18-month renewals rather than long-term commitments.
Developers have responded. The national pipeline fell from a record 9.8 million SF at the end of 2022 to 9.4 million SF at the start of 2024, 7.4 million SF at mid-2025 and 5.9 million SF (128 million cubic feet) at the end of 2025, its lowest level since 2020. The MMCG census counts 24 buildings and 6.37 million SF under construction as of October 2026, of which 20 buildings and 5.58 million SF (88%) are fully pre-committed to an owner-user or anchor tenant. Only four speculative buildings totaling about 0.8 million SF are underway nationally. A further 50 proposed projects total 12.96 million SF, with 3.35 million SF pre-committed; most of the remainder will not break ground without a tenant. Newmark describes the modest first-half 2026 uptick in starts as "primarily owner-build and build-to-suit groundbreakings." New York-Philadelphia and Los Angeles-Inland Empire, two of the three largest cold storage markets, have almost nothing under construction. Chicago construction fell about 65% to 589,000 SF in the first quarter of 2026.
Rents have stopped rising. Newmark's weighted-average taking rent on new leases for cold storage was $27.40 per SF in 2026 to date against about $28 in 2025, a reversal after a near-doubling from about $14 in 2019. Lineage expects net price increases of 1% to 2% in 2026 and reports pressure in about 15% of U.S. markets. Americold reported storage rate per pallet "flipping from slightly down in the first quarter to up in the second," but same-store storage revenue per physical pallet was still 2.9% lower year over year. The premium over dry warehouse survives on new leases of modern product, at roughly 2.2 times the national industrial asking rent, but it is being paid for 40-foot automated buildings, not for the sector: quoted asking rents across the full MMCG census, most of them on pre-2006 buildings, center on $11 to $12 per SF, close to general industrial.
Lineage closed 10 facilities in 2025 and 5 more in 2026 through August, idling about 2.5 million SF, or 1% of its U.S. portfolio. Americold has identified 25 sites for strategic exit, completed 10 exits removing about 160,000 pallet positions and 2.8 million SF, and is marketing 15 idled sites holding about 350,000 pallet positions and 3.2 million SF. The MMCG census records 98 cold storage buildings (8.2 million SF) as demolished, plus 108 buildings and 5.7 million SF actively listed for sale with a combined asking price of $558 million; 74 of the 108 were built before 1990. The legacy stock is being retired, and that retirement is the mechanism by which the market will eventually re-tighten.
The Vintage Divide: What the MMCG Census Shows
The vintage divide deserves its own treatment because it changes how every other figure in this report should be read. A national vacancy rate of 7.7% or an availability rate of 8.9% describes an average of three markets that behave differently.
The first market is legacy stock built before 2006. In the MMCG census this is 221 million SF, 70.8% of the national inventory, with a median clear height in the low 20s and a median age over 40 years. It is 9.3% available overall and roughly 12% available in the pre-1990 subset. These buildings were designed for 1980s pallet throughput, low-density racking and manual handling; many run on refrigeration plants that predate modern efficiency standards and cannot support automation. Their occupancy depends on customers who have not yet found modern alternatives, and the record 2023 to 2025 delivery wave gave many of them that alternative. Lineage management observed that customer switching is most pronounced one to two years after new supply delivers, which places the peak legacy move-out in 2026 and 2027.
The second market is modern conventional stock built between 2006 and 2019: 52 million SF, 16.6% of the inventory, median clear height 32 feet, 5.9% available in the MMCG census and 3.4% vacant in the Newmark series. The 2010 to 2019 subset, 37.4 million SF, is 2.5% available. This cohort is the sweet spot: tall enough for dense racking, new enough for efficient refrigeration, old enough to have been leased before the 2022 rent spike and therefore competitively priced, and located in the distribution nodes that mattered before speculative capital arrived. Owners of this product have pricing power and face little competition from new supply because the pipeline has collapsed.
The third market is post-2020 stock: 39.3 million SF, 12.6% of the inventory, median clear height 40 feet, 12.0% available. This is the best physical product in the country, and it is the product that absorbed the speculative capital of 2021 and 2022. Its availability is a lease-up problem, not an obsolescence problem. A 2025-vintage freezer at 23% availability is not a distressed asset; it is an asset that was underwritten to a 12-month lease-up and will take 24 to 36 months. The distinction matters for lenders because the exit for this product is a stabilized sale into the deepest pool of institutional capital in the sector, while the exit for legacy product is often a dry conversion, a user sale or demolition.
The three markets will converge over time through two mechanisms. Legacy retirements shrink the denominator; the census already records 8.2 million SF demolished, and Americold alone is marketing 3.2 million SF of idled sites. Post-2020 lease-up, supported by a pipeline that is now almost entirely pre-committed and by new deliveries that Lineage expects to run below 2% of the market in 2026 and 2027, lifts the numerator. Neither mechanism works quickly. MMCG's base case holds national vacancy in the 7.5% to 8.0% range through the end of 2027, with modern-vintage vacancy below 4% throughout.
Geography: Where Capacity Is, and Where It Is Being Built
The geography of U.S. cold storage depends on the unit of measurement, and the 2025 edition blurred the distinction. Measured in refrigerated cubic feet, which rewards high-cube freezer warehouses in production states, California leads with 10.0% of national capacity, followed by Georgia (7.6%), Washington (7.5%), Wisconsin (7.4%), Texas and Florida (6.4% each), Pennsylvania (5.7%), Illinois (4.8%), Oregon (3.5%) and New Jersey (3.4%). The top 15 states hold 75% of national capacity. Measured in building square footage, which rewards consumption markets with many smaller distribution buildings, the MMCG census puts California at 15.1%, Texas at 9.4%, Illinois at 7.9%, Florida at 6.9%, Georgia at 5.2%, Pennsylvania at 4.3%, Washington at 3.4%, New Jersey at 3.3%, Wisconsin at 2.9% and Indiana at 2.7%. The 17% California share carried previously was a revenue-and-facility metric; it is valid on that basis and should not be quoted as a capacity share.
Georgia is the structural story of this cycle. Its gross refrigerated capacity rose from 172 million to 304 million cubic feet between October 2023 and October 2025, its warehouse count from 49 to 62. The Savannah port complex now has nearly 2.4 million SF of near-port cold storage across a dozen facilities, including MEDLOG's 291,000 SF Rincon facility opened in September 2025, with PermaCold's 216,000 SF Darien facility due in 2026. South Carolina's capacity nearly tripled over the same period from a small base, driven by Charleston port-adjacent openings. The Southeast Atlantic ports have become the principal gateway for frozen protein exports and produce imports, and the capacity has followed. Savannah is now a supply-risk market for a new public refrigerated warehouse: MMCG requires pre-leasing or anchor credit before supporting a feasibility determination there.
Texas is the largest build market but not the fastest-growing capacity state. USDA shows Texas gross capacity down 3.0% over two years, a decline within the survey's response-rate noise, while the MMCG census shows 4.51 million SF of Texas cold storage under construction or proposed, more than any other state. Dallas-Fort Worth is the largest single market in the MMCG census at 17.2 million SF across 105 buildings, with 13.5% availability and a median year built of 1985. Lineage broke ground in November 2025 on a fully automated, Tyson-anchored facility in Hutchins that will anchor one of two sites totaling more than 80 million cubic feet. Newmark projects Dallas-Fort Worth needs a further 2.8 million SF by 2035, Houston 1.3 million SF and Atlanta about 1 million SF. Houston, by contrast, is tight today: 5.9 million SF of census inventory at 2.9% availability, with FreezPak's 282,000 SF first phase at Cedar Port in Baytown delivered and refinanced in September 2026. San Antonio's 325,000 SF STX Frio speculative project broke ground in mid-2026 for a late-2027 delivery, one of the few speculative starts in the country.
The legacy gateways present the opposite profile: large, old and oversupplied at the low end. Los Angeles proper holds 10.7 million SF across 192 census buildings with a median year built of 1969 and 7.5% availability; the Inland Empire adds 6.8 million SF at 16.1% availability. Southern California combined is 22.6 million SF at 9.5% availability, and Newmark reports essentially nothing under construction. Philadelphia carries 6.9 million SF at 19.3% availability, the highest of any major market in the census, reflecting both legacy move-outs and new deliveries in the Lehigh Valley and South Jersey corridors. The combined New York and New Jersey markets hold 8.5 million SF at 10.7% availability. Chicago holds 14.2 million SF at 7.4%, with modern product reported below 1% vacant and legacy product driving the headline.
The production markets remain full. California's Central Valley (Stockton, Fresno, Visalia, Bakersfield, Sacramento and smaller nodes) holds 18.8 million SF at 7.8% overall, but the core agricultural nodes of Fresno (4.7 million SF, 0.4% available) and Stockton (5.1 million SF, 1.0% available) are effectively at capacity. Wisconsin's dairy and meat cold storage shows 3.4% availability statewide. Massachusetts and Providence, serving the New England seafood and distribution trade, show 1.3% and 0.4% respectively. These are not growth markets, but they are stable ones, and they illustrate that the oversupply is a distribution-market phenomenon concentrated in the Sun Belt and the Mid-Atlantic rather than a national condition.
Kansas City emerged as a rail-gateway node in 2025 with more than 900,000 SF delivered across three projects, including Americold's $100 million-plus import-export hub with CPKC and Vertical Cold's 311,000 SF facility. Newmark's market durability index names Kansas City, Phoenix, Columbus, Nashville, Charleston and Tampa as the secondary hubs with the strongest consumption and food-manufacturing growth. Phoenix holds 4.6 million SF in the census at 9.8% availability. Border capacity at Laredo and McAllen is growing in small increments while Laredo cold storage employment rose 92% year over year in 2025, which suggests demand running ahead of physical additions. Reno and Indianapolis are operator-driven nodes rather than broker-documented hubs; Indiana's 8.7 million SF of census inventory shows 16.4% availability, almost all of it in buildings completed between 1957 and 2002, led by a fully vacant 703,000 SF Fort Wayne building from 1962.
Ownership of the national stock is concentrated at the top and fragmented below. Within the roughly 890 census buildings with recorded ownership, Lineage holds 89 buildings and 20.4 million SF and Americold 63 buildings and 13.9 million SF. Prologis, Link Logistics, Kroger, Ahold and United States Cold Storage follow at 1 million to 2.5 million SF each. The remaining ownership is spread across hundreds of regional operators, food companies and private investors, which is where the financial pressure on smaller operators that both national REITs described in 2026 is concentrated.
Demand Re-Examined: Channel Shift, Flat Volumes and Trade Swings
The 2025 edition grounded demand in three drivers: premium fresh food, e-commerce grocery and pharmaceuticals. All three remain real. None of them is growing cold storage demand fast enough to absorb the 2023 to 2025 supply wave, and the reason is that cold storage demand follows inventory, not consumption.
Online grocery is the clearest example of a driver that is stronger than the earlier edition assumed yet matters less than it implied. The 13.6% share by 2027 carried previously came from a January 2023 forecast. Brick Meets Click's June 2025 forecast puts online at 13.5% of grocery in 2025, 14.3% in 2026, 15.2% in 2027 and 16.1% in 2028, growing at 8.9% a year against 1.7% for in-store. On the broader FMI and NielsenIQ definition that includes non-food consumables, online grocery was already about one-fifth of spending in 2025 and is forecast at 25.5% by 2028. Brick Meets Click's own monthly survey recorded a 19% share in December 2025 with sales up 32% year over year, driven by membership-led delivery. The channel is growing faster than anyone forecast. But the channel shift moves perishable inventory from store back rooms to retailer-owned perishable distribution centers and micro-fulfillment nodes, which is why Walmart is building five new high-tech perishable DCs rather than leasing third-party freezer space. Online grocery supports forward, metro-adjacent, retailer-anchored cold capacity. It does not support speculative bulk freezer in secondary markets.
Food volumes are flat. Circana puts 2025 food and beverage dollar sales up 3.2% with price and mix contributing 3.0% and volume 0.2%, and guides 2026 volume flat to slightly negative. Frozen food retail sales reached $87 billion in the year to September 2025, more than 45% above 2019, but nearly all of that gain was price; retailers sell about one billion more frozen units a year than in 2019. Frozen department units turned marginally positive (+0.2%) in July and August 2026 after several months of decline. GLP-1 medications are a measurable but modest headwind: about 23% of U.S. households now include a user, those households cut grocery spending by about 5.3% within six months, concentrated in snacks and indulgent categories, and spending recovers when users stop. Protein-forward frozen items, frozen fruit and vegetables are growing; frozen meals and seafood are shrinking. None of this adds net pallets to the national cold chain.
Trade policy has become the largest short-term swing factor in cold storage occupancy, and the direction of the swing has reversed within the year. China's March 2025 retaliation and the lapse of registrations at about 386 of 654 U.S. beef establishments effectively closed the Chinese market to U.S. beef and pork for most of 2025, with effective duties reaching 172% on pork and 147% on beef in April before the May truce and the November framework agreement. The Supreme Court's February 2026 ruling against the IEEPA tariffs, the 150-day Section 122 surcharge that followed and the Section 301 tariffs that took effect in July 2026 have kept import and export flows volatile. USDA's monthly cold storage report shows the result: total pork in storage swung from 5% below the prior year in February 2026 to 12% above it by August 31, 2026, total red meat was up 8%, beef up 5%, while chicken was down 5% and frozen fruit down 4%. Lineage attributed a roughly 14% drop in container volumes in the second quarter of 2026 to trade disruption. Protein that cannot be exported sits in domestic freezers, which supports occupancy at Gulf and Southeast port warehouses in the short run but reflects stalled trade rather than growing demand. For underwriting, MMCG treats the 2025 to 2026 range of minus 5% to plus 12% in protein inventories as the sensitivity band for throughput and occupancy at commodity-exposed facilities.
Pharmaceutical cold chain is the one demand vector growing faster than supply, but it is small relative to food and it is being built by the pharmaceutical distributors themselves. U.S. pharmaceutical logistics is estimated at $26.5 billion in 2023 growing to $45.2 billion by 2030, about 8% a year, with cold chain the fastest-growing segment and ultra-low and cell-and-gene-therapy storage growing in the teens. Cencora committed $1 billion to its U.S. distribution network through 2030, including a Dothan, Alabama expansion raising refrigerated storage 500% and frozen storage 200%, a 500,000 SF automated Texas facility with controlled-room, refrigerated, frozen, ultra-low and cryogenic storage opening in 2028, and a tripling of ultra-low and cryogenic capacity. Sharp Services added 4,400 temperature-controlled pallet positions in Pennsylvania; GEODIS opened a healthcare cold cross-dock in Chicago. The pattern is captive or dedicated, GDP-validated and anchored. MMCG applies no pharmaceutical rent premium in a feasibility study without a named anchor tenant and a validated design.
Vertical integration, flagged as a long-term risk in the 2025 edition, is now the dominant form of new supply. Walmart opened a 725,000 SF perishable distribution center in Wellford, South Carolina in September 2025, the third of five new high-tech perishable DCs, each of which Walmart says processes more than double the volume of a traditional facility; the fourth, a 1.2 million SF fresh and frozen facility in Belvidere, Illinois, was energized in October 2026 for a 2027 opening, and Walmart is adding 500,000 SF of automation to each of four existing perishable DCs. Kroger announced a $391 million automated distribution center in Franklin, Kentucky. Publix is building a 370,000 SF frozen warehouse in Jacksonville for 2027 and expanding its existing freezer. H-E-B is adding an automated frozen line in Temple, Texas. Lineage's $740 million-plus pair of fully automated, Tyson-anchored facilities and its $256 million acquisition of four Tyson warehouses show the third-party operators adapting by becoming anchored developers rather than speculative landlords. The USDA data confirm the aggregate: private capacity up 30% in two years, public capacity down 2%.
Capital Markets: The Trough Is In, the Recovery Is Not
The listed operators give the market its earliest signal, and in 2026 that signal has been stabilization without recovery. Lineage reported same-warehouse physical occupancy of 75.8% in the second quarter of 2026 against 74.9% a year earlier, a 90-basis-point gain that management called "a welcome inflection point" and the first year-over-year improvement since the July 2024 IPO; economic occupancy, which counts contractually committed pallets, was 81.5%. Americold reported global physical occupancy of 67.4%, up 460 basis points, and same-store physical occupancy of 69.1%, up 290 basis points, although about half of the global gain came from a 6.0% reduction in pallet capacity through exits and idling rather than from new volume. Both companies raised 2026 AFFO guidance in August 2026. Both still report negative same-store net operating income, Lineage at minus 2.9% and Americold at minus 1.5%, and both describe customers as short-duration and price-sensitive, preferring 12-to-18-month renewals.
The share prices tell a harder story. Lineage priced its IPO at $78 in July 2024, raising $4.4 billion in the year's largest offering; it traded at about $34 in early October 2026, 56% below the offer price, with market capitalization down from $18.2 billion to $8.7 billion, and it faces a securities class action. Its 2026 AFFO guidance midpoint of $2.925 per share is 13% below the 2025 actual of $3.37, driven by expiring interest rate hedges, flat occupancy and a $15 million EBITDA headwind from a fire at its Big Bear facility in Los Angeles. Leverage stands at 6.0 times against a 5.0 to 5.5 times target, and management has said it needs to divest "a little over $1 billion" of assets, with a comprehensive portfolio update due by year-end 2026. Americold trades at about $14, roughly 41% below its early-2025 high but 48% above its 2026 low after the EQT transaction crystallized private-market value. It changed chief executive in September 2025 and chief financial officer in February 2026, recorded a $309.6 million second-quarter impairment, primarily on the wind-down of its automated Lancaster, Pennsylvania and Plainville, Connecticut facilities after a customer relationship changed, and completed $30 million of indirect labor and overhead savings with a further $50 million identified.
The Americold-EQT joint venture is the pricing event of the cycle. Announced in May and closed on August 31, 2026, Americold contributed 12 U.S. facilities with a gross asset value above $1.3 billion, about 124 million cubic feet and 402,000 pallet positions, to a partnership in which EQT's Active Core Infrastructure fund holds 70% and Americold 30% as manager. The transaction was struck at a 7.0% capitalization rate, or about $3,300 per pallet position, against a public-market valuation of about $1,500 per pallet that management had cited earlier in the year; Americold received about $1.15 billion of proceeds, repaid about $1.1 billion of debt and reduced leverage by roughly three-quarters of a turn. J.P. Morgan and Morgan Stanley financed the venture, which holds a four-year first look at Americold's North American developments. Infrastructure capital has priced stabilized, operator-managed U.S. cold storage at 7.0%, and that is now MMCG's base-case exit assumption for comparable assets.
The MMCG sales census records the repricing at the property level. Cold storage transactions above $100,000 totaled $636 million across 56 deals in 2023, $846 million across 48 deals in 2024, $1.63 billion across 55 deals in 2025 and $2.00 billion across 53 deals in the first nine months of 2026; the 2026 figure includes $1.06 billion of allocated values from nine facilities contributed to the EQT venture, leaving about $944 million of conventional trades. Transactions of $20 million or more rose from 6 in 2023 and 9 in 2024 to 24 in 2025 and 20 so far in 2026, which marks the return of institutional buyers to the sector. The pricing split by vintage is stark: buildings completed in 2006 or later traded at a square-footage-weighted $329 per SF in 2025 and $301 per SF in 2026, while buildings completed before 2006 traded at $164 per SF in 2025 and at a median of $96 per SF in 2026. The largest trades of the period were the EQT venture allocations on Americold's Allentown facilities ($235 million and $205 million) and two South Plainfield, New Jersey facilities ($157 million and $155 million, or $630 and $721 per SF), Walmart's $223 million owner-user purchase of a 507,000 SF Inland Empire facility at about $440 per SF, a 350,000 SF 2025-built facility in McDonald, Tennessee at $166 million ($474 per SF), W. P. Carey's $140 million purchase in Santa Fe Springs and a 727,000 SF Coppell, Texas building at $126 million ($174 per SF). Modern, credit-anchored or infill product trades at $300 to $700 per SF; legacy multi-tenant product trades at $100 to $200.
The buyer pool has changed shape. Owner-users made up about 36% of cold storage buyers in the first half of 2026, up from 32% in 2025 and 10% in 2024, which reflects both food companies' preference for captive capacity and thin investor liquidity at the legacy end. The institutional entrants of 2025 and 2026 are infrastructure and core-plus capital buying operator-backed or credit-leased assets: EQT, Slate Asset Management and Hamilton Lane (majority stake in Cold-Link Logistics), Heitman and Artemis (the Provender and Cerberus 11-property recapitalization, with PGIM providing $140.5 million of floating-rate debt), MetLife Investment Management (the 291,000 SF plant-attached CJ Logistics facility in New Century, Kansas), W. P. Carey and Clarion Partners (Southern California). No sovereign wealth acquisition of U.S. cold storage was identified in the period. Merchant speculative development capital has left.
Debt is available but selective. Disclosed 2025 and 2026 financings are concentrated in build-to-suit and leased assets from life companies, Canadian pension capital and banks: QuadReal's $78.5 million refinancing of a 268,000 SF Lula, Georgia facility fully leased to CJ Logistics (about $293 per SF), PGIM's $140.5 million on the Artemis portfolio (about $164 per SF), UMB Bank's $30 million on Arctic Cold's $60 million Santa Maria acquisition (about 50% of price), and a $33.9 million four-year floating-rate construction facility for Cold-Link in Rhode Island. No major brokerage or lender has published cold-storage-specific term sheets. From the disclosed deals and current market data, MMCG's working parameters are 60% to 70% loan-to-cost for pre-leased construction and 50% to 60% or no financing for speculative product; 55% to 65% loan-to-value for stabilized acquisitions; bank and life company spreads of roughly 225 to 325 basis points over SOFR for credit-leased assets and 350 to 500 basis points from debt funds for operator-risk assets; debt yields of 9% to 10% for leased assets and 11% to 12% for multi-tenant operator assets; and minimum debt service coverage of 1.30 to 1.40 times for leased assets and 1.50 times for operator-risk assets. Lenders give only partial collateral credit to refrigeration plant, so recovery value in a dry-conversion scenario is low.
Operating Costs and Regulation: Relief on Rules, Pressure on Power
The regulatory risks the 2025 edition highlighted have eased. EPA's final Technology Transitions reconsideration rule, published May 26, 2026 and effective July 27, 2026, gives new cold storage warehouse systems an interim 700 GWP refrigerant limit through December 31, 2031, in place of the 150 and 300 GWP limits that had been scheduled for January 1, 2026; the stricter limits now apply to new systems from January 1, 2032. The HFC production and consumption cap stays at 60% of baseline through 2028 and steps down to 30% in 2029, which EPA itself expects to raise HFC prices materially. Ammonia and carbon dioxide systems, which IIAR reports are used at 91% and 5% of surveyed facilities respectively, are unaffected under every scenario. A coalition of 18 states, the District of Columbia and New York City, with NRDC filing separately, petitioned the D.C. Circuit on July 21, 2026 to vacate the relief; a decision is unlikely before 2027. MMCG's position is that an HFC-blend design installed under the interim limit carries refrigerant-price and residual-value risk that a natural-refrigerant design does not, and feasibility studies should price that difference.
The FSMA Section 204 food traceability rule, originally due January 20, 2026, is now operative from July 20, 2028 after FDA proposed a 30-month extension and Congress barred enforcement before that date in the November 2025 appropriations act. For a cold storage operator holding foods on the Food Traceability List, the rule requires a written traceability plan, capture of eight key data elements at receiving and eight at shipping linked to the supplier's traceability lot code, and production of records to FDA within 24 hours. It is a systems requirement rather than a capital item, but it is a commercial requirement already: Walmart and Sam's Club have required advance ship notices carrying FSMA 204 data elements from all food and beverage suppliers since August 2025. An operator without a lot-level warehouse management system is losing retailer business well ahead of the federal deadline.
Power is the cost that moved in 2026. EIA's average U.S. industrial electricity price rose 6.0% in 2025 to 8.62 cents per kWh and 6.8% year over year in the first five months of 2026 to 8.83 cents, more than twice the rate of consumer inflation. The dispersion by state is the largest single operating-cost lever in site selection: California averaged 21.62 cents in 2025 and 25.11 cents in July 2026, Texas 6.55 and 7.07 cents, Georgia 7.81 and 10.03 cents, Illinois 10.14 cents for 2025, up 14.8% in a single year as the ComEd zone capacity price in PJM's auction rose from $28.92 to $269.92 per megawatt-day. A refrigerated warehouse uses roughly 24.9 kWh per SF per year against about 6.1 for a dry warehouse. Lineage reports power as its second-largest cost after labor and uses rate escalations and power surcharges in customer contracts; Americold attributed its second-quarter 2026 same-store margin compression of 120 basis points primarily to an 11.3% increase in power costs. MMCG models energy at 12% to 18% of facility operating cost for freezer-heavy assets, stress-tested at 7% annual growth, and treats a power pass-through clause as a required covenant in any lease or storage agreement supporting a loan.
Labor cost growth has halved but still runs above inflation. Hourly compensation in warehousing and storage rose 4.8% in 2025 after 8.4% in 2024 and 7.5% in 2023; average hourly earnings for all warehousing employees were $26.74 in August 2026, with refrigerated roles carrying a premium of roughly 15% to 20% for freezer-floor conditions. The quits rate in transportation and warehousing fell to 2.2% in 2025 from 3.0% in 2022. Labor remains about 46% of operating cost at a conventional facility, which is the economic case for automation: Lineage reports 83 automated warehouses (25 fully, 58 semi-automated) among 482, about 17%, with 89% of pallet positions under construction designed as fully automated and about 22% lower electricity use per pallet position at automated sites. Americold's Lancaster and Plainville write-down is the counter-case; management's statement that "a few years ago, it was a heavy trend to automate for automation's sake" is a warning that automated, customer-dedicated buildings carry concentration risk that a lender must underwrite as such.
Insurance has moved in the industry's favor at the market level. Marsh reported U.S. property rates down 13% in the second quarter of 2026, the eighth consecutive quarterly decline. No broker publishes a premium index specific to ammonia refrigeration or freezer buildings, and the asset-level picture remains demanding: combustible expanded-polystyrene or polyurethane insulated panels can bring higher premiums or restricted coverage, FM-approved panel assemblies cost 8% to 18% more, and ammonia systems carry EPA Risk Management Program and OSHA Process Safety Management obligations. MMCG budgets flat to modestly lower premiums for well-protected, FM-approved, fully sprinklered freezer assets and requires a broker indication before loan sizing on anything else.
Construction costs have not fallen. Newmark's blended range of $130 to $350 per SF for cold storage against $85 to $150 for dry warehouse, with $100 to $150 for dry-to-cold conversion, sits alongside contractor and vendor indications of roughly $150 to $250 for cooler, $200 to $350 for freezer and $380 to $600 for automated high-bay freezer. The 2025 edition's $250 to $350 range described freezer product and should not be applied to the sector. At these costs, a stabilized yield on new speculative freezer development requires rents the current market is not paying, which is why the pipeline has moved almost entirely to pre-committed product.
Cold Storage Against General Industrial: The 2026 Comparison
The 2025 edition presented cold storage as the high-performance cousin of general industrial: lower vacancy, higher rents, less speculative overbuilding, converging yields. The 2026 comparison reverses most of those relationships.
| Metric (latest available) | Cold storage | All U.S. industrial |
|---|---|---|
| Vacancy | 7.7% (Newmark, 2Q26); MMCG census availability 8.9% (Oct 2026) | 7.3% (Oct 2026), availability 9.4%; 6.5% to 7.3% across brokers at Q2 2026 |
| Direction | Rising; first negative first-half absorption since 2007 | Peaked late 2025; falling for two consecutive quarters |
| Vacancy by segment | 2006 to 2019 stock 3.4%; pre-2006 stock 8.2%; post-2020 stock 10.9% | Small-bay under 6%; 100,000 to 500,000 SF logistics above 10% |
| Rent | $27.40 per SF weighted-average taking rent, 2026 YTD, down about 2% from 2025 | $12.24 per SF asking, up 1.4% year over year, slowest since 2012 |
| Under construction | 5.9M SF at YE 2025 (lowest since 2020); MMCG census 6.4M SF, 88% pre-committed | 408M SF; 12-month deliveries 263M SF |
| 2025 deliveries | About 10M SF, a record | About 263M SF trailing 12 months |
| Inventory | 346M SF (Newmark); 319M SF (MMCG census); 1.9% of industrial base | 19.4 billion SF |
| Capitalization rate | 7.0% (Americold-EQT JV, Aug 2026); 7.5% to 8.0% for legacy or short-WALT | Stabilized multi-tenant mid-5% to 6%; completed-deal average 6.8% (2026 YTD) |
| Yield spread | Cold prices above top-quartile industrial; MMCG estimate 75 to 150 bps | Benchmark |
| Construction cost | $130 to $350 per SF blended; $200 to $350 freezer | $85 to $150 per SF |
| Transaction volume | About $2.0 billion 2026 YTD including $1.06 billion JV allocations (MMCG census) | $101.7 billion trailing 12 months |
| Buyer mix | Owner-users about 36% of buyers (1H 2026); infrastructure and core-plus funds | Institutional about half of $50 million-plus deals; private capital dominant below $10 million |
Three observations follow. First, cold storage vacancy now sits at or above general industrial vacancy, a reversal of the relationship that held through the previous cycle, and the two series are moving in opposite directions, with cold storage lagging the industrial cycle by two to four quarters. Second, the rent premium survives but has stopped compounding: cold storage taking rents on new leases are about 2.2 times industrial asking rents, below the two-to-three-times premium the 2025 edition described, and the premium is earned by modern product alone. Third, the yield spread has re-widened. Cold storage trades 100 to 150 basis points above stabilized multi-tenant logistics on the 2026 evidence, which is closer to its long-run transactional history than the 40-basis-point appraisal spread of 2023 ever was.
Underwriting Implications for Lenders and Developers
MMCG applies the following parameters to cold storage feasibility studies prepared in the fourth quarter of 2026. They replace the parameters implied by the 2025 edition.
Vacancy and lease-up. Underwrite submarket vacancy of 7.5% to 8.0% through 2027, then use vintage-specific assumptions: 3% to 4% for 2006 to 2019 product in primary nodes, 8% or more for pre-2006 product, and a 24-to-36-month lease-up for speculative post-2020 product, against pre-2022 norms of 12 months. Model a 300,000 SF speculative building as a two- or three-tenant lease-up, not a single-tenant one. Net out announced captive and anchored deliveries in the submarket (Belvidere, Franklin, Jacksonville, Hutchins and their equivalents) before concluding that unmet demand exists.
Occupancy for operator-model assets. Stabilized physical occupancy of 75% to 80% for modern multi-tenant public refrigerated warehouses, consistent with Lineage's 75.8% to 79.3% same-store range across 2025 and 2026. Underwrite on economic occupancy where fixed commitments exist, at 80% to 82%, and haircut for the shift to 12-to-18-month renewals. Americold's same-store physical occupancy of 69.1% is the downside case.
Rent and revenue growth. Storage rate growth of 1% to 2% a year for 2026 and 2027, flat to 1% in the roughly 15% of U.S. markets with acute oversupply, and no more than 3% from 2028 and only if the pipeline stays pre-committed. Services and handling revenue growth of 2% to 3% per throughput pallet. Do not extrapolate 2021 to 2023 rate growth. Do not apply a pharmaceutical premium without a named anchor and a validated GDP design.
Expenses. Energy at 12% to 18% of operating cost for freezer-heavy assets, stressed at 7% annual growth; a power pass-through or escalation clause is a condition of any supporting lease or storage agreement. Labor at 4% to 5% annual growth. Insurance flat to modestly down for FM-approved, fully sprinklered, natural-refrigerant buildings; a broker indication is required before sizing for anything else. Margin stress of 100 to 150 basis points.
Exit capitalization rate. Base case 7.0% for stabilized, operator-managed, multi-tenant assets, anchored to the Americold-EQT transaction. 6.25% to 6.75% for long-term, investment-grade, credit-leased build-to-suits. 7.5% to 8.0% for pre-2006 or short-weighted-average-lease-term assets. Maintain at least 75 basis points over the Class A dry logistics exit cap and run a 50-basis-point downside.
Construction cost. Product-specific ranges: $150 to $250 per SF for cooler, $200 to $350 for freezer, $380 or more for automated high-bay, $100 to $150 for dry-to-cold conversion. Obtain a contractor quote from a specialist builder before committing capital; no public contractor benchmark exists. Natural-refrigerant systems are compliant under every regulatory scenario; HFC-blend designs carry 2029 and 2032 cost risk.
Debt sizing. Size to the most constraining of 60% to 65% loan-to-cost or loan-to-value for pre-leased or credit-leased product (50% to 55% for speculative), a 10% minimum debt yield and 1.35 times debt service coverage at a stressed rate. Require pre-leasing or a committed operator before closing a construction loan; Lineage's own $1.1 billion development pipeline is 71% pre-leased. Structure completion guarantees and interest reserves for a 24-month or longer lease-up. Assume partial collateral credit for refrigeration plant and a low recovery in a dry-conversion scenario.
Sponsor and operator diligence. Weight operator credit and contract duration heavily. The 2026 market rewards scale operators that are, in Americold's words, taking share from "smaller, less sophisticated operators facing financial pressure." That statement describes elevated default risk among precisely the regional operators that most often borrow under SBA 7(a), SBA 504 and USDA Business and Industry programs. A feasibility study for a regional cold storage borrower in 2027 must demonstrate committed customers, a modern building, a low-cost power market and a natural-refrigerant design, or it must demonstrate a niche (port, border, produce belt, seafood, pharmaceutical anchor) in which the national operators do not compete.
Outlook, 2027 to 2030
The sector will clear, but not quickly and not evenly. MMCG's base case runs as follows.
Through 2027, national cold storage vacancy holds in the 7.5% to 8.0% range. New deliveries run below 2% of inventory a year, almost entirely pre-committed. Legacy move-outs continue as the 2023 to 2025 delivery wave finishes drawing customers from pre-1990 buildings; the peak of that migration is 2026 and 2027. Post-2020 buildings lease up at 24 to 36 months rather than 12. The listed operators complete their deleveraging, Lineage through its $1 billion-plus divestiture program and Americold through the EQT venture and the sale of its idled sites, which puts another 3 to 5 million SF of legacy and non-core product into a private market that is already pricing it at $100 to $200 per SF. Same-store net operating income at the national operators turns positive during 2027 as repricing of the 2024 to 2025 contract vintage completes.
From 2028, the vintage divide starts to close. Legacy retirements, demolitions and dry conversions remove capacity that the headline vacancy rate currently counts as available. The USDA capacity census due in early 2028 will likely show public capacity falling again and private capacity rising again, continuing the eight-year trend. The 2006 to 2019 cohort remains effectively full throughout, and the 2020s cohort approaches stabilization. Rents resume growth at 2% to 3% a year in modern product, led by markets with the least new supply: Houston, the Central Valley, New England and the port nodes where captive demand has not displaced third-party demand. Markets that absorbed the most speculative capital, Dallas-Fort Worth, Philadelphia and the Inland Empire, lag.
The demand base grows slowly and shifts in composition. Food volume stays flat to 1% a year. Online grocery passes 16% of grocery spending on the food-centric definition and 25% on the broad definition, pulling perishable inventory into retailer-owned networks. Pharmaceutical cold chain compounds at 8% to 10% but builds captive. Trade policy continues to swing protein inventories by double-digit percentages within a year, which rewards operators with flexible, port-adjacent freezer capacity and penalizes single-commodity exposure. The third-party industry's addressable market grows slower than the cold chain as a whole, and its revenue growth stays in the low single digits.
Capital returns to the sector at the new price. A 7% yield on stabilized, operator-managed cold storage, with 75 to 150 basis points of spread over Class A logistics, is attractive to infrastructure and core-plus investors who could not justify the sub-5% yields of 2021. The Americold-EQT structure, an infrastructure fund owning the real estate with a national operator managing it and holding a development first look, is the template others will copy. Development returns to merchant builders only where a credit anchor exists. Speculative freezer development on the 2021 model does not return in this cycle.
The 2025 edition closed by describing cold storage as "a strategic asset class set to thrive." The sector's long-run position is unchanged: an essential, hard-to-replicate link in the food and pharmaceutical supply chain, with an aging physical stock that will need to be rebuilt over the next two decades. What the 2026 evidence adds is discipline. Cold storage is a cyclical real estate asset with high operating leverage, a short contract book, meaningful obsolescence risk and a demonstrated capacity for oversupply. It should be financed as one.
Frequently Asked Questions
What is the U.S. cold storage vacancy rate in 2026?
National cold storage vacancy reached 7.7% at mid-2026 according to Newmark, the highest level in more than 20 years, up from 4.4% in early 2024 and about 6.9% at the end of 2025. MMCG's property-level census of 318.9 million SF shows 8.9% of inventory marketed as available in October 2026. Vacancy is concentrated in buildings built before 2006 (8.2%) and in buildings completed since 2020 that are still leasing up (10.9%). Buildings built between 2006 and 2019 are about 3.4% vacant.
Is the U.S. cold storage market oversupplied?
Yes, by roughly 10% according to Lineage, which cited data showing public refrigerated warehouse supply up 14.5% between 2021 and 2025 against consumer demand growth of about 5%. The oversupply is concentrated in distribution markets that received speculative deliveries in 2023 to 2025 (Dallas-Fort Worth, Philadelphia, the Inland Empire) and in legacy buildings, not in production markets such as California's Central Valley or in modern 2006 to 2019 product. New construction has fallen to about 6 million SF nationally and is 88% pre-committed, so the oversupply is being worked down rather than added to.
What cap rate applies to cold storage in 2026?
The best transactional anchor is 7.0%, the rate at which Americold contributed 12 stabilized U.S. facilities to a joint venture with EQT in August 2026, equivalent to about $3,300 per pallet position. Long-term credit-leased build-to-suits price tighter, in the 6.25% to 6.75% range; legacy or short-lease-term assets price wider, at 7.5% to 8.0%. Cold storage now trades 75 to 150 basis points above stabilized Class A logistics, not the 40 basis points that appraisal-based indices showed in 2023.
How much does it cost to build a cold storage warehouse in 2026?
Roughly $150 to $250 per SF for cooler space, $200 to $350 per SF for freezer space and $380 to $600 per SF for automated high-bay freezer, against $85 to $150 per SF for a dry warehouse and $100 to $150 per SF to convert dry space to cold. Newmark's blended sector range is $130 to $350 per SF. Natural-refrigerant (ammonia or carbon dioxide) systems are compliant under every current and pending federal rule; HFC-blend systems installed under EPA's interim 700 GWP limit face stricter limits for new systems from 2032 and rising refrigerant prices after the 2029 phasedown step.
Which states have the most cold storage capacity?
By refrigerated cubic feet (USDA, October 2025), California leads with 10.0% of national capacity, followed by Georgia (7.6%), Washington (7.5%), Wisconsin (7.4%), Texas and Florida (6.4% each), Pennsylvania (5.7%) and Illinois (4.8%). By building square footage (MMCG census, October 2026), California holds 15.1%, Texas 9.4%, Illinois 7.9%, Florida 6.9% and Georgia 5.2%. Georgia's capacity rose 76% between 2023 and 2025, the largest increase of any state, driven by the Savannah port cold chain.
What should a lender require in a cold storage feasibility study in 2027?
Vintage-specific vacancy assumptions rather than a single market rate; a 24-to-36-month lease-up for speculative product; evidence of committed customers or an anchor tenant before construction; a natural-refrigerant design or an explicit allowance for HFC transition cost; a power pass-through clause and energy modeled at 12% to 18% of operating cost with 7% annual escalation; a 7.0% base-case exit capitalization rate with a 50-basis-point downside; and a demonstration of why the subject facility will win customers against national operators that are actively taking share from smaller regional borrowers. MMCG's cold storage feasibility studies for SBA 7(a), SBA 504, USDA Business and Industry and conventional lenders are built on these parameters.
Sources
- Newmark, 1H 2026 U.S. Cold Storage Market Overview, August 27, 2026
- Newmark, 2H 2025 U.S. Cold Storage Market Overview, March 26, 2026
- Newmark, H1 2025 U.S. Cold Storage Market Overview, October 6, 2025
- Newmark, Cold-Storage Mid-Year Outlook, AFIRE Summit, August 2024
- Newmark, Sold on Cold: Temperature-Controlled Development Pipeline Reaches New Record, March 2023
- Newmark, 2Q26 U.S. Industrial Market Conditions and Trends, August 11, 2026
- MMCG Invest, MMCG Cold Storage Census, property-level review of 2,834 existing U.S. refrigerated and cold storage buildings, pipeline and sales records, and industrial benchmark reports for the U.S., Los Angeles, Inland Empire, Dallas-Fort Worth, Chicago, Northern New Jersey and Atlanta, October 2026, built on CoStar Group data licensed to MMCG Invest
- USDA National Agricultural Statistics Service, Capacity of Refrigerated Warehouses 2025 Summary, February 9, 2026
- USDA National Agricultural Statistics Service, Capacity of Refrigerated Warehouses 2023 Summary, January 31, 2024
- USDA National Agricultural Statistics Service, Cold Storage monthly reports, January through September 2026
- USDA Foreign Agricultural Service, GAIN Report CH2025-0056 and Livestock and Poultry: World Markets and Trade, 2025
- IBISWorld, Refrigerated Storage in the US (NAICS 49312), June 2026 edition
- U.S. Bureau of Labor Statistics, Industry Productivity series for NAICS 493120 and 493, Current Employment Statistics and JOLTS, 2025 and 2026 releases
- Lineage, Inc., Form 10-K for fiscal year 2025, filed February 25, 2026
- Lineage, Inc., Second-Quarter 2026 Financial Results and earnings call, August 5, 2026; Fourth-Quarter 2025 results and call, February 25, 2026; Third-Quarter 2025 results, November 2025
- Americold Realty Trust, Second Quarter 2026 Results and Quarterly Supplemental, August 6, 2026; Fall 2026 investor presentation; Form 8-K on the Americold-EQT Cold Storage Partnership, May 7 and August 31, 2026
- FreightWaves, coverage of Lineage facility closures and the cold storage supply glut, February and August 2026
- Bisnow, Cold Storage Vacancy at 20-Year High as Food Spending Tightens, March 26, 2026, and Cold Storage Facilities See Record Vacancy, Flight to Newer Properties, August 27, 2026
- Commercial Property Executive, Cold Storage Market Increasingly Bifurcated, March 26, 2026
- REjournals, Chicago's Cold Storage Reset and Negative Net Absorption coverage, 2026
- CBRE, Q2 2026 U.S. Industrial and Logistics Market Report and Q2 2026 Capital Markets Report
- JLL, U.S. Industrial Market Dynamics, Q1 and Q2 2026
- Cushman and Wakefield, U.S. Industrial MarketBeat, Q2 2025 through Q3 2026
- AEW Research, The Role of Cold Storage in the Supply Chain, June 2024
- Global Cold Chain Alliance, 2026 Global Top 25 rankings and Driving the Cold Chain, 2026
- Brick Meets Click and Mercatus, U.S. Grocery Sales Five-Year Forecast 2025 to 2029, June 3, 2025, and monthly eGrocery sales releases through August 2026
- FMI and NielsenIQ, Digital Engagement Transforms Grocery Shopping, April 22, 2026
- Circana, 2025 and 2026 Food and Beverage Outlook and GLP-1 research, November and December 2025
- American Frozen Food Institute and FMI, Power of Frozen in Retail 2026, February 23, 2026
- Cornell SC Johnson College of Business and Numerator, GLP-1 household food spending study, Journal of Marketing Research, December 2025
- Grand View Research, U.S. Pharmaceutical Logistics Market report, 2024 to 2030
- Cencora, U.S. distribution network investment releases, November 5 and December 2, 2025
- Walmart, perishable distribution center announcements, September 2025 and October 2026; Kroger, Franklin, Kentucky distribution center announcement, December 2025; Publix, Jacksonville freezer warehouse permits, 2025 and 2026
- Georgia Ports Authority, MEDLOG Savannah cold chain facility release, September 12, 2025
- Missouri Department of Economic Development and Americold, Kansas City import-export hub opening, August 12, 2025
- U.S. Environmental Protection Agency, Phasedown of Hydrofluorocarbons: Reconsideration of Technology Transitions Requirements, Final Rule, 91 FR 31284, May 26, 2026, and HFC allocation rules
- U.S. Food and Drug Administration, FSMA Final Rule on Requirements for Additional Traceability Records for Certain Foods and compliance date extension, 2025; Congressional Research Service report R48925
- State of California et al., Petition for Review, U.S. Court of Appeals for the D.C. Circuit, Case No. 26-1168, July 21, 2026
- U.S. Energy Information Administration, Electric Power Monthly, July and September 2026 issues, and Electricity Explained annual price data
- PJM Interconnection, 2025/2026 and 2026/2027 Base Residual Auction results
- Marsh, Global Insurance Market Index, Q2 2026, July 23, 2026
- Gallagher, Combustible Panels in Cold Storage: Fire Risks and Insurance Challenges, July 2025
- International Institute of Ammonia Refrigeration, comment letter to EPA citing the 2023 GCCA Productivity and Benchmarking Survey, June 2025
- REBusinessOnline, Connect CRE and JLL, coverage of 2025 and 2026 cold storage transactions and financings, including the Walmart Riverside acquisition, the PGIM Artemis loan, the QuadReal Lula refinancing and the BGO and Yukon New Century sale
- MMCG Invest, Refrigerated Storage Industry Analysis in the US, Current Market and Outlook, May 21, 2025, updated March 22, 2026 (superseded by this report)

Michal Mohelsky, J.D., FMVA, Practicing Affiliate of the Appraisal Institute
Principal, MMCG Invest, LLC
Published October 13, 2026. How this analysis was prepared.
Cite this
Michal Mohelsky, J.D., FMVA (2026). U.S. Cold Storage Market Outlook 2026: Record Vacancy and a Market Divided by Vintage. MMCG Invest, LLC. https://www.mmcginvest.com/post/u-s-cold-storage-market-outlook-2026-record-vacancy-and-a-market-divided-by-vintage
Where this goes next
- Cold Storage Feasibility Study: Refrigerated Warehouses and Food Processing Under USDA B&I, SBA 504 and Bank FinancingMMCG's feasibility study page for this subject.