Interactive Maps 6
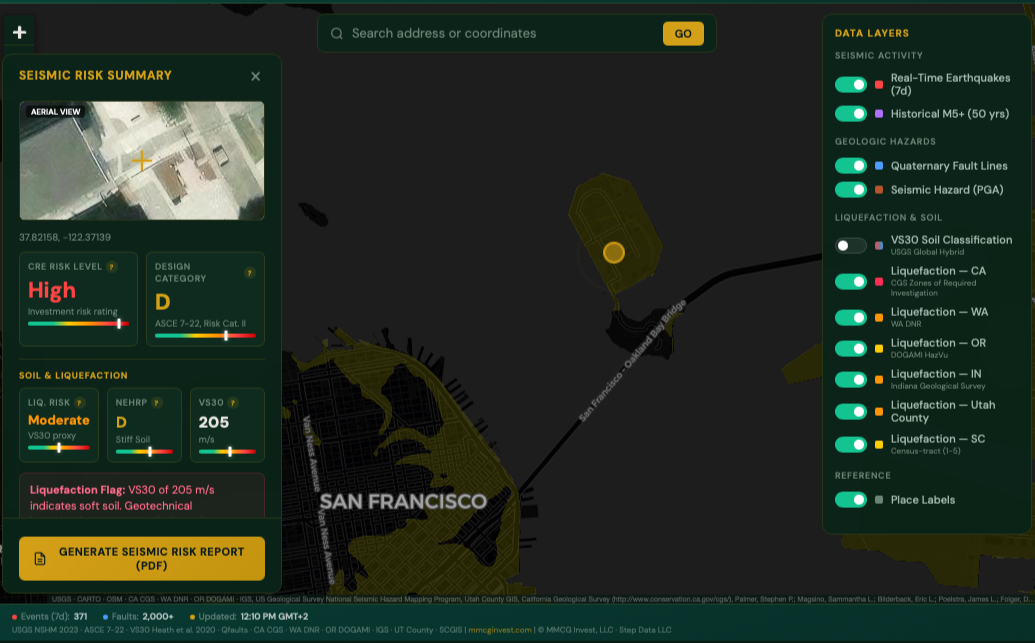
Seismic Risk Map
Real-time USGS earthquake feed, Quaternary fault lines, liquefaction zones across six states (CA, WA, OR, IN, UT, SC), VS30 soil classification, and ASCE 7-22 seismic design categories. Click any U.S. location for an instant CRE risk screening with lender trigger analysis, including ASTM/UBC seismic zones, PGA thresholds, and Fannie Mae/Freddie Mac SRA requirements. Generates downloadable PDF seismic risk reports with aerial imagery. Built for acquisition due diligence, SBA/USDA feasibility studies, and institutional lending packages.
Wind Risk Map by Address
Screen any U.S. location for wind-driven natural hazards using FEMA National Risk Index and NOAA Storm Prediction Center data. Covers tornado, hurricane, severe thunderstorm, and straight-line wind exposure with county-level Expected Annual Loss scores, historical event density, and ASCE 7-22 wind design categories. Generates lender-ready risk briefings for acquisition due diligence, SBA/USDA feasibility packages, and property insurance positioning.
USDA Eligibility Map
Check whether a property address qualifies for USDA Rural Development financing across six program categories: B&I, Community Facilities, SFH/MFH Housing, Water & Environmental, Rural Business Service, and General Business Programs. Check all programs simultaneously or individually. Includes Census Bureau ACS 5-Year tract-level demographics. Covers all 50 states.
Flood Zone and Wetlands Map
Search any U.S. address to identify its FEMA flood zone designation and NWI wetland status. Covers all 11 NFHL zones (A, AE, AH, AO, AR, A99, V, VE, X shaded, X unshaded, D) with investor-grade analysis of insurance requirements, lending constraints, construction standards, and valuation impacts. NWI overlay with Cowardin classification and Section 404 permitting guidance.
U.S. Oil Infrastructure Map
Comprehensive interactive map of 61 U.S. petroleum refineries, 15 crude oil terminals and inland hubs (including St. James and Cushing), and 33 pipeline systems across seven corridor categories. Toggleable layers for refineries by capacity class, terminals, pipelines, railroad overlays, and highway networks. Validated against operator filings, SEC disclosures, MARAD records, and port authority data. Data as of Q1 2026.
U.S. Seaports Logistics Map
Interactive map of 17 major U.S. container and bulk cargo seaports with TEU throughput, channel depths, intermodal rail/highway connectivity, and port authority investment data. Designed for industrial, logistics, and warehouse feasibility analysis near port corridors. Data as of Q1 2026.
Loan Calculators 2
SBA vs USDA Loan Comparison Calculator
Compare SBA 504, SBA 7(a), USDA B&I, and SBA Express side by side. Enter your project cost once and see which program delivers the best loan size, equity requirement, guarantee percentage, and total borrowing cost. Rate spreads calibrated from FOIA loan-level data (10,351 loans, Q1 FY2026) with three borrower strength profiles. Live market rates via FRED. Fee schedules reflect FY2026.
USDA B&I Loan Calculator
Model a complete USDA Business & Industry loan scenario in seconds. Calculates monthly payments, annual debt service, DSCR, upfront guarantee fees (3.0%), annual retention fees (0.55%), and borrower equity requirements. Includes full amortization schedules with CSV export. Updated for FY2026 guarantee tiers: 85% under $5M, 80% for $5M to $25M.
All tools are provided free of charge for informational and planning purposes. Results are estimates and do not constitute financial advice or a guarantee of program eligibility. For project-specific analysis, contact our team to discuss a formal feasibility study.