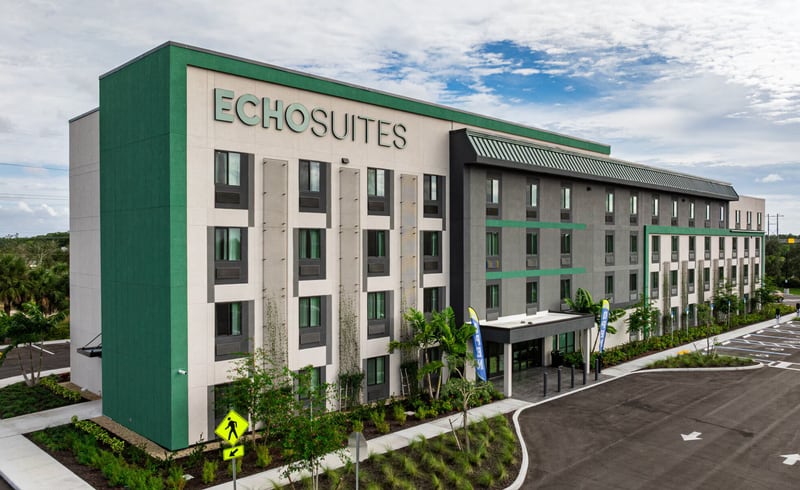
Summary
Hotels are the largest industry in the 7(a) program by dollar volume and one of its safest. Almost none of those hotels have a restaurant. The reasons for that are arithmetic, appraisal and amortization, and only the last of them is still doing all of its work.
29 minute read.
There is a sentence that appears in most SBA hotel credit memos we have read, and in a fair number we have written. It goes roughly like this: limited-service hotels carry lower risk than full-service because they break even at lower occupancy.
The conclusion is defensible. The reason is not. On a total-hotel basis, luxury and full-service properties break even at lower occupancy than select-service, because the restaurant, the ballroom and the spa carry part of the fixed-cost base that a rooms-only building has to carry by itself. The ranking only reverses when you restrict the calculation to rooms revenue and rooms variable cost, which is a legitimate basis but not the one the sentence implies. We deal with that inversion in detail in a companion piece on the hospitality side of the house, and we will not repeat it here beyond noting that the figure most people quote is measured on a different basis than the one they think.
What this piece is about is the other half of the question. If the break-even argument is on the wrong basis, why is the SBA hotel book still, overwhelmingly and durably, a limited-service book? And why has it performed so well?
The short answer is that three separate mechanisms push SBA hotel lending toward the limited-service end of the market, and none of them is about break-even. One is arithmetic: the loan cap and the cost per key. One is appraisal: what the going-concern allocation does to eligible collateral. One is structural: what a 23-year amortizing owner-operator loan does at the bottom of a cycle that a five-year balloon does not. The first two are as strong as they have ever been. The third is the one carrying the weight, and it is worth understanding why, because the demand-side arguments that used to sit alongside it are visibly weakening.
What the book actually looks like
Start with the size of it. Across the life of the program, SBA has guaranteed roughly 25,000 7(a) loans to hotels and motels, about $44 billion in original principal. That makes NAICS 721110 the single largest industry in the 7(a) program by dollars lent. The cumulative charge-off rate on that book, program-to-date through 2024, is about 1.8%. The seasoned all-industry 7(a) rate for the 2010 to 2019 vintages runs closer to 6.4%. Full-service restaurants charge off at roughly 5.9% and limited-service restaurants at 6.6%. Hotels sit alongside dental and veterinary practices, which is not company anyone expected a lodging asset to keep.
The loans are large. The average hotel 7(a) runs between $2.6 million and $2.7 million, which is four to five times the all-program average, because a hotel deal bundles land, building, FF&E, franchise fees and working capital into a single credit in a way most small-business loans do not. And the book is pressed against the cap. A meaningful share of hotel 7(a) loans are written at or near the $5 million maximum, which is the first clue that the loan size, not the credit quality, is what is sorting borrowers into the limited-service segment.
The franchise concentration confirms it. By loan count, the SBA hotel book is dominated by economy and midscale flags: Super 8, Days Inn, Quality Inn, Comfort Inn, Best Western, La Quinta, Motel 6. By dollar volume, the weight shifts up one tier into upper-midscale select-service: Holiday Inn Express, Hampton, Fairfield, Home2 and their peers. What is absent from both lists, almost entirely, is any brand with a full-service restaurant, a banquet operation or a meeting floor of consequence. That absence is not a policy. It is a consequence, and the next section explains what it is a consequence of.
Arithmetic before credit
The 7(a) program caps a single loan at $5 million. That is a hard number and it does not index. Development cost per key, by contrast, indexes every year, and it has been indexing hard.
At the 2025 median figures published in the HVS development cost survey, a limited-service hotel costs roughly $167,000 per key to build and a select-service hotel roughly $223,000. Take a $5 million 7(a) at a typical 85% loan-to-cost and the total project it can fund is about $5.9 million. Divide that by the per-key medians and the answer is 35 economy keys or 26 select-service keys. That is the whole hotel. Land, building, FF&E, soft costs and the franchise application fee, inside 26 rooms.
Nobody builds a 26-key Hampton. The prototype is 80 to 120 rooms. So in practice a new-build select-service hotel cannot be a 7(a)-only deal, and a full-service hotel, where the per-key cost runs to multiples of the select-service figure once you add the kitchen, the ballroom and the back-of-house to support them, is not in the conversation at all.
This is where the 504 program and the stacked structures come in. A standard 504 debenture caps at $5 million, or $5.5 million for projects that qualify under the green or manufacturing provisions, but the bank's first mortgage in a 504 structure is not capped by SBA. Total 504 hotel projects in the $12 million to $20 million range are common, and since July 2026 a borrower can hold a $5 million 7(a) and a $5 million 504 debenture at the same time, which lifts the SBA-guaranteed component of a single project to $10 million. It still does not reach a full-service hotel of any size in any market where one would be built.
The equity side pushes the same direction. The SOP sets a 10% minimum injection for startups and complete changes of ownership. In practice, lenders and CDCs underwriting a special-purpose property ask for 15%, and a startup borrower acquiring or building a special-purpose property is routinely asked for 20%. Those higher figures are market convention layered on a codified floor, not a single SBA number, and we say so in our studies rather than presenting them as rule. But the effect is real: a full-service project requires more equity, on a larger base, from a borrower profile that is by definition an owner-operator rather than an institution.
So before anyone has run a pro forma, the loan cap and the cost per key have already sorted the book. The credit analysis that follows operates inside a segment the arithmetic chose.
The operating statement, and where the margin actually lives
The second mechanism is quieter and takes longer to explain, because it runs through the appraisal rather than the loan sizing. To get there we need the operating statement.
The 2024 national hotel operating statement, drawn from the MMCG hospitality series across the full U.S. inventory, shows total revenue of $98,301 per available room and $412.39 per occupied room. Rooms account for 62.4% of that revenue. Food, beverage and other F&B together account for 28.8%. Other operated departments and miscellaneous income make up the balance. Gross operating profit comes in at 33.5% of total revenue and EBITDA, after management fees, property taxes, insurance and rent, at 24.0%. Total labor runs 36.9% of revenue.
Two lines inside that statement do more work than the headline. Rooms department expense runs 27.1% of rooms revenue. Food and beverage expense runs 73.1% of F&B revenue. Put plainly: a dollar of rooms revenue delivers about 73 cents to the department line, and a dollar of F&B revenue delivers about 27 cents. The entire margin difference between a limited-service hotel and a full-service hotel is contained in that pairing. Rooms departments look much the same across chain scales. What changes is how much of the building's revenue is being earned at 27 cents on the dollar instead of 73.
That has a consequence people miss when they quote the national margin as a benchmark. The national sample carries 37.6% of its revenue outside rooms, which means it is weighted toward full-service composition. A limited-service hotel runs 90% to 97% rooms. Strip the F&B and other-department lines from the national statement, hold the undistributed stack, and the gross operating margin that falls out for a rooms-only operation is materially above the 33.5% headline. We publish that reconstruction and its method in the companion piece. The point here is narrower: a lender who benchmarks a limited-service pro forma against the national GOP margin is benchmarking against a different animal, and the pro forma will look aggressive when it is merely rooms-heavy.
The same statement explains why full-service properties carry more operating leverage, which matters later. Labor is 36.9% of total revenue in the national sample. In a full-service hotel, labor runs 40% to 55% of revenue, against 25% to 32% at limited-service, because the kitchen, the restaurant floor and the banquet staff are there whether or not the rooms are sold. When revenue falls, a rooms-only hotel can flex its housekeeping hours. A full-service hotel cannot flex its chef.
What the appraisal does to the collateral
Now the appraisal. This is the mechanism that gets the least attention and does the most quiet damage to full-service deals in an SBA file.
SBA treats hotels and motels as special-purpose property, and lists them first among its examples of the category. For a special-purpose property, the lender must obtain an independent appraisal from a Certified General appraiser, and the SOP is specific about who qualifies: the appraiser must have completed at least four going-concern appraisals of equivalent special-use property within the previous 36 months. Restricted appraisal reports are not accepted. And the appraisal must allocate separate values to the components of the transaction: land, building, equipment and intangible assets. That allocation requirement has been in the SOP since 50 10 5(H) in 2015 and carries forward unchanged into 50 10 8.
The allocation is where the service model bites. A hotel is appraised as a going concern, which means the value conclusion includes the real estate, the furniture, fixtures and equipment, and the intangible business value: the flag, the reservation system, the assembled workforce, the operating goodwill. FIRREA and the interagency appraisal guidelines require the appraiser to isolate the market value of the real estate alone, because that is what the bank's lien attaches to. Whatever is assigned to FF&E and to intangibles is not real-property collateral.
How much gets assigned depends on the method, and the hospitality appraisal profession has been arguing about the method for twenty years. The Rushmore approach isolates business value by deducting the management fee and the franchise fee from the income stream, plus a return on and of the FF&E. The business enterprise approach associated with David Lennhoff and the Appraisal Institute starts from total business assets and additionally deducts the value of the assembled workforce, the brand affiliation, residual goodwill and startup costs. On the same full-service Marriott used as the worked example in Stephen Rushmore's own defense of his method, the Rushmore approach put the real-property component at about 60% of total value and the business component at 17%. The business enterprise approach on the same property put real property at 36%. Courts in California and Florida have found, in property-tax cases, that deducting management and franchise fees alone does not remove all intangible value. Those are ad valorem cases, not SBA cases, but the methodological direction they point is the one lenders are increasingly asked to follow.
Here is why it sorts the book. Intangible value is larger, as a share of the whole, for a full-service hotel than for a limited-service one. Rooms revenue is a smaller share of total revenue, the F&B and banquet operations generate business income that is not attributable to the building, and a brand-managed full-service property carries an assembled workforce and a management contract that an owner-operated Comfort Inn does not. So the carve-out is bigger, the real-estate-only collateral value is smaller relative to the loan, and the collateral shortfall is larger. Under the SOP, a shortfall the lender cannot cover with business assets reaches the personal real estate of any owner holding 20% or more.
A lender looking at a full-service hotel with a $9 million going-concern appraisal may find $5.5 million of it is real property, once the appraiser has done what the SOP requires. The same lender looking at a limited-service hotel appraised at $9 million might find $7.5 million. The loan is sized against the second number in both cases. The deal that works is the one where the second number is close to the first, and that is structurally the deal without a restaurant.
We put a caveat on the figures because the research supports it. There is no single authoritative source that publishes a clean limited-service-versus-full-service pair for intangible share. The 17% and 36% figures above are method-specific results on one property. The direction, full-service carrying more intangible value than limited-service, is well supported. The magnitudes are not, and a study that presents them as norms is overstating what the literature will bear.
The study nobody is required to order
One more thing about the credit file, because it is widely misunderstood and the misunderstanding shapes how hotel studies get written.
SBA does not require a feasibility study for a hotel. It does not require one for anything. The only codified hook is 13 CFR 120.160(b), which says SBA may require professional appraisals, a survey, or a feasibility study as a condition of the loan. May. The SOP names no preparer credential, no content standard and no independence requirement for a feasibility study. USDA, by contrast, codifies all three in 7 CFR Part 5001. We wrote a separate piece last month on the SBA requirement that does not exist and the USDA one that does, and the distinction matters here because it explains what a hotel study is actually for.
In practice, lenders order a study wherever repayment rests on projections rather than history. That means startups, ground-up construction, complete changes of ownership, and special-purpose property, which hotels always are. The study is not satisfying a rule. It is answering the question the credit reviewer will ask, which is where the numbers came from. The SBA Office of Inspector General's high-risk loan review program has for years listed unsupported projected sales among the recurring deficiencies that justify denial of the guaranty. In the FY2019 cycle, a review of eight early-defaulted loans found material origination deficiencies on five, worth about $8.7 million in denied guaranties. Unsupported projected sales is the audit name for a missing feasibility analysis.
What sends hotel studies back is consistent across the lender guidance and the appraisal literature. Unsupported ADR premiums over the competitive set. Occupancy penetration that assumes favorable absorption without accounting for the pipeline. A management fee below 3% of revenue, or omitted because the owner will self-manage. An FF&E reserve at zero in the early years with no ramp. A comp set that benchmarks the subject against the wrong service model. Expense ratios more than a few points below the property-type benchmark with no property-specific reason. None of these is exotic. All of them are more likely in a full-service study than a limited-service one, because a full-service study has more lines that can be wrong.
The three deductions
Every hotel pro forma carries three deductions that sit between gross operating profit and debt service, and together they decide whether the deal clears coverage. The service model changes all three.
The first is the franchise load. The HVS franchise fee guide, which models total franchise cost from the franchise disclosure documents over a ten-year initial term, puts the all-brand average at 10.8% of rooms revenue. The industry median is 11.2%. By service model the medians are closer than most borrowers expect: 11.19% for limited-service, 11.32% for select-service, 12.30% for full-service. But the averages hide the brand spread. Hampton runs 15.7% of rooms revenue, Holiday Inn Express 14.7%, Comfort Inn 13.6%, La Quinta 12.7%, Fairfield 12.1%, Best Western 8.3%. A study that loads the 10.8% average on a Hampton is understating the fee by five points of rooms revenue.
There is a wrinkle that cuts the other way. Franchise fees are expressed as a percentage of rooms revenue, and for a limited-service hotel where rooms are 90% to 97% of the total, the load on total revenue is nearly the same number. For a full-service hotel where rooms are 60% to 68% of total revenue, the load on the whole operation is materially lighter, unless the brand also charges an F&B royalty, which the larger Marriott, Hilton and Hyatt full-service flags do. So the franchise deduction is proportionally heavier on the limited-service side. That is one of the few structural disadvantages the segment carries, and it is a real one.
The second is the management fee. Hotel management companies charge a base fee of 2% to 4% of total operating revenue, with 3% the most common figure, plus an incentive fee on full-service and institutional deals. An appraisal or feasibility study applies a management fee even where the owner intends to self-manage, because the lender underwrites to professional management and the reviewer will insert one if the study does not. The effective floor is 3%. Studies that come in below it get sent back.
The third is the FF&E reserve. The stabilized convention is 4% of total revenue, with a documented ramp: commonly 1% to 2% in the first two operating years, 3% in year three or four, 4% by year five. The CMBS market writes exactly that ramp into loan documents. Franchise agreements often require 2% to 5%. Lenders deduct the reserve from NOI before sizing debt regardless of whether the franchise agreement requires an escrow. A 4% reserve and a 3% base management fee together take about seven points of total revenue off the top before the first dollar of debt service. On a $6 million revenue limited-service hotel that is $420,000 a year the pro forma has to find before coverage is tested.
The coverage floors themselves are worth stating because they are changing. Standard 7(a) requires 1.15x operating coverage on an EBITDA basis and 1.00x global. Lenders underwriting hotels tend to look for 1.25x on their own account. From October 1, 2026, under SOP 50 10 8.1, a first-time change-of-ownership acquisition must show 1.25x on historical cash flow with projections no longer counted toward it, which is the first time SBA has codified a hotel-relevant floor above 1.15x.
When the subject has a restaurant
Everything above explains why full-service hotels rarely reach an SBA file. When one does, usually a boutique, a conversion, or a historic property in a market where the brand standard requires a restaurant, the study has to do work that a limited-service study never does. This is where we see the largest gap between what borrowers submit and what a reviewer will accept.
A limited-service study rests almost entirely on rooms demand: the competitive set, the demand segmentation into commercial, leisure and group, the penetration analysis and the ADR positioning. A full-service study needs all of that plus a demand case for every operated department. The restaurant has to be modeled as a business in its own right, with cover counts, average check, food cost and labor, and a demand source that is not just the hotel's own guests. The banquet and meeting operation needs its own demand analysis: what corporate, association and social group business exists in the market, what share of it the subject can capture against competitors with comparable space, and what it converts to in rooms nights and catering revenue. Meeting space is a demand generator, particularly for stable weekday group business, and corporate groups generate the most ancillary F&B revenue. A study that shows a ballroom on the plans and a banquet revenue line on the pro forma, with nothing connecting them, will not survive review.
The staffing model is the other place full-service studies fail. A full-service hotel runs 1.0 to 1.5 full-time equivalents per available room. Select-service runs 0.4 to 0.6. Limited-service runs 0.25 to 0.35. A study that applies a blended labor percentage from a limited-service benchmark to a full-service subject will understate payroll by a factor of two to three, and it will be the first thing a hotel-literate reviewer checks. The staffing build has to be department by department, front office, housekeeping, kitchen, restaurant, banquet, engineering, with hours per occupied room supporting each line.
The competitive set changes too. A full-service subject with meeting space has to be benchmarked against properties with comparable meeting space and group orientation, and the segmentation has to add and size a group segment. Benchmarking a full-service or group-oriented subject against a limited-service comp set, because those are the hotels within five miles, is the single most common reason full-service studies get challenged.
One program detail matters for 504 deals specifically. The occupancy rules under 13 CFR 120.131 require the borrower to occupy at least 51% of an existing building and 60% of a new one, with permanent leasing of up to 20% and temporary leasing of another 20% permitted on new construction. A full-service hotel that leases its restaurant to a third-party operator, which is increasingly common, has to fit that lease inside the permitted percentages, and the cost of finishing the leased space is not an eligible project cost. It is a detail, but it is the kind of detail that surfaces at closing rather than at application.
October 1
SBA published SOP 50 10 8.1 on August 14, 2026, effective for loans receiving an SBA loan number on or after October 1. Because the effective date is three weeks away and hotel deals take longer than that to close, most hotel files in process today will be approved under the new SOP.
What changes is concentrated in change-of-ownership lending, which has moved into a new Appendix 15. The coverage floor for a first-time acquisition rises to 1.25x on historical cash flow, with projections excluded. A lender-ordered quality of earnings report becomes mandatory on initial acquisitions and business expansions with a purchase price of $3 million or more, which will catch most hotel acquisitions. Outside investor equity is capped. A series of post-June-2025 notices are consolidated into the text.
What does not change is anything that bears on hotel appraisal, special-purpose treatment, or third-party reports. The going-concern allocation requirement carries forward. The appraiser qualification carries forward. The absence of a codified feasibility requirement carries forward. We say this plainly because we were asked repeatedly, in the weeks after the notice, whether 8.1 would change the hotel study. It does not. It changes the acquisition file, and for a hotel acquisition the quality of earnings requirement is the practical new cost, not anything in the study.
The leg that is still standing
Which brings us back to the question the credit memo sentence was trying to answer. If limited-service hotels do not break even at lower occupancy, why has the SBA hotel book performed the way it has?
The historical evidence gives three reasons, and it is worth separating them because they are not aging at the same rate.
The first is margin flexibility. When revenue falls, full-service margins give way faster. In 2009, the STR HOST survey put full-service gross operating margin at 29.4%, down from 34.3% the year before. Limited-service fell to 47.1% from 51.2%. Fewer points lost, from a base seventeen points higher. In 2020, CBRE's sample showed luxury and upper-upscale EBITDA falling by more than 100%, convention hotels by 149%, against 71.6% for midscale and economy on comparable revenue declines. Across the two downturns, limited-service margins contracted by about 220 basis points in recession against roughly 300 for full-service. The mechanism is the labor line: a rooms-only operation cut hours, a full-service operation could not cut its kitchen.
The second is demand composition and recovery speed. Economy and midscale RevPAR was back at 2019 nominal levels in 2021. Luxury and upper upscale did not get there until late 2023 or 2024. Interstate and highway locations were running at 110% of 2019 revenue while urban hotels were at 65%. Drive-to leisure and transient commercial demand came back first, and that is what limited-service sells.
The third is structure, and it is the one nobody writes about. Limited-service CMBS delinquency peaked at 23.56% in December 2020, higher than full-service at 19.28%. Institutional limited-service hotels did not default less at the trough. They defaulted more. And yet the SBA hotel book, overwhelmingly limited-service, shows a 1.8% cumulative charge-off across thirty years that include two of the worst downturns lodging has seen. The difference is not the asset. It is the wrapper. A CMBS hotel loan carries a five- to ten-year balloon that comes due whether or not the market is open. An SBA hotel loan amortizes over roughly 23 years, is secured by real estate, is owner-operated by someone whose livelihood is the building, and has no refinance event at the bottom of the cycle. The government guarantee matters too, but it matters after default, not before. What prevents the default is that there is no maturity to fail.
Now hold those three reasons against what the current data shows, because two of them are eroding.
Midscale and economy RevPAR fell 1.4% in 2023, 1.2% in 2024 and 3.4% in 2025. Demand in that tier fell 4.3%, 2.1% and 2.5% over the same years, against supply that was also shrinking, which means occupied room nights contracted faster than available ones for three consecutive years in an economy that was growing. Over the same period luxury and upper-upscale RevPAR rose 6.1%, 2.5% and 1.9%, and is up 7.4% year to date in 2026. The trailing-twelve-month spread stands at $194 of RevPAR at the top of the market against $47 at the bottom, on occupancy of 67.6% against 54.7%. The demand stability that made limited-service the fast-recovering segment after 2009 and 2020 is not visible in the numbers since.
Limited-service CMBS delinquency tells the same story from the credit side. It cured to 3.48% by 2022, which is the recovery-speed argument working. It has since risen back to 8.35% as of July 2025, the worst of any lodging subtype, and Trepp attributes the re-deterioration to deferred capital expenditure and functional obsolescence rather than to any demand shock. The share of limited-service properties spending under $750 per key on capital improvements jumped to 54% in 2020 and reinvestment has not normalized. The margin cushion that flexed in 2020 was, in part, borrowed from the FF&E reserve, and the bill is arriving as property improvement plans come due.
The exit side is consistent with both. Midscale and economy hotels trade at a market cap rate of about 10.3% and roughly $69,000 per room. Luxury and upper upscale trade at 7.9% and about $419,000. The spread has widened since 2022. And the construction pipeline is still 140,000 rooms, about 84,000 of them in upscale, upper-midscale and midscale, which is to say that new supply continues to be built into the segment where demand has been falling.
So of the three legs, margin flexibility is being consumed by deferred reinvestment, demand stability is no longer what the trailing data shows, and the amortizing owner-operator structure is the one still fully intact. That is not a reason to stop lending to limited-service hotels. It is a reason to be clear, in the study and in the credit memo, about which leg the deal is actually standing on.
What we do differently in a hotel file
None of this changes the conclusion most lenders reach. It changes what the study has to demonstrate to support it. Five things, in the order a reviewer will look for them.
State the basis of every break-even and margin figure. Total-hotel or rooms-only, GOP-level or debt-inclusive, national sample or segment. The numbers move by ten points depending on the basis, and a reviewer who has read the companion piece will ask.
Ramp the FF&E reserve and say why. Zero in year one with no ramp is the single most common reason a hotel study gets sent back, and after 2020 it is also the line where the segment's actual risk now lives. We ramp from 2% to 4% and we say in the text that the stabilized figure is below what capital spending surveys show the segment actually spends.
Load the franchise fee from the brand's own disclosure document, not the industry average. The spread between Best Western and Hampton is seven points of rooms revenue.
Build labor from county wage data and hours per occupied room, not from a national percentage. On a 100-room limited-service hotel in a small market the base payroll is a specific number that can be checked, and the reviewer will check it.
Run the downside case with a flex that reflects 2020, not the textbook. The rule of thumb says 30% to 35% of a lost revenue dollar is protected at the GOP line. In 2020 the CBRE annual sample lost 62.2% of revenue and 82.6% of GOP. For the first year of a severe shock, a flex of 15% to 25% is what the record supports, improving in later years as fixed labor is cut.
And say, in the study, which of the three legs the deal is standing on. If it is the amortization, say so. That is not a weakness in the credit. It is the reason the book has worked, and a lender who understands it will underwrite the deal more accurately than one who still believes the break-even sentence.
Frequently asked questions
Does SBA require a feasibility study for a hotel loan?
No. The only codified hook is 13 CFR 120.160(b), which says SBA may require one. The SOP sets no preparer credential, content standard or independence requirement for a feasibility study. In practice, lenders order one for any hotel that is a startup, a ground-up build, a complete change of ownership, or otherwise underwritten on projections rather than history, because the credit reviewer and the guaranty purchase process will ask where the projections came from.
Why are almost all SBA hotel loans limited-service?
Three reasons, none of them about credit quality. The $5 million 7(a) cap funds about 35 economy keys or 26 select-service keys at current per-key costs, so anything larger needs a 504 structure and a full-service hotel is out of reach of either. The going-concern appraisal SBA requires carves more intangible value out of a full-service hotel, leaving less real-property collateral against the loan. And full-service projects need more equity on a larger base from an owner-operator borrower.
What changes for hotel loans under SOP 50 10 8.1?
Nothing in the appraisal, special-purpose or feasibility provisions. The changes are in change-of-ownership lending: a 1.25x coverage floor on historical cash flow for first-time acquisitions, a mandatory quality of earnings report on acquisitions of $3 million or more, and a cap on outside investor equity. For a hotel acquisition the quality of earnings report is the practical new cost.
What management fee and FF&E reserve should a hotel study carry?
A base management fee of 3% of total revenue, applied even if the owner self-manages, and an FF&E reserve ramping from 1% to 2% in the early years to 4% of total revenue at stabilization. Both are market convention rather than SBA rule, but both are effective floors in review, and studies that come in below them get sent back.
Is a limited-service hotel a safer SBA credit than a full-service hotel?
The SBA hotel book has performed well, and it is almost entirely limited-service, so the historical answer is yes. But the reason is not that limited-service breaks even at lower occupancy, which is not true on a total-hotel basis. It is that limited-service margins give way more slowly in a downturn, that drive-to demand has historically recovered faster, and that a 23-year amortizing owner-operator loan has no balloon to fail at the trough. The first two of those are weakening in the current data. The third is not.
September 11, 2026 by Michal Mohelsky, principal of MMCG Invest, LLC, a national SBA and USDA hospitality and hotel feasibility study consultancy
Michal Mohelsky, J.D. | Principal | mmcginvest.com
Contact: michal@mmcginvest.com
Phone: (628) 225-1110
Sources
- U.S. Small Business Administration, SOP 50 10 8, Lender and Development Company Loan Programs, effective June 1, 2025
- U.S. Small Business Administration, Notice 5000-880695, Issuance of SOP 50 10 8.1, August 14, 2026, effective October 1, 2026
- 13 CFR 120.160, Loan conditions, and 13 CFR 120.131, Leasing part of new construction or existing building
- U.S. Small Business Administration, Information Notice 5000-1340, Issuance of SOP 50 10 5(H), 2015
- SBA Office of Inspector General, Report 19-22, Consolidated Results of the OIG High Risk 7(a) Loan Review Program, September 26, 2019
- SBA Office of Inspector General, Report 17-18, High Risk 7(a) Loan Review Program
- SBA FOIA 7(a) and 504 loan-level datasets, NAICS 721110, analyzed by SBALenders.com, Understanding SBA Loan Failures, 2025
- Wilary Winn, Insights From the SBA 7(a) Loan Program, April 2024
- HVS, U.S. Hotel Development Cost Survey, 2025 edition
- HVS, 2020 U.S. Hotel Franchise Fee Guide, Russell and Kim
- HVS, 2023 U.S. Hotel Franchise Fee Guide, released February 2024
- HVS, A New Approach to Hotel Management Fees, Marcus R. Lee
- HVS, In Defense of the Rushmore Approach, Stephen Rushmore, December 15, 2005
- HOTELS Magazine, Valuation Strategies for the New Normal, on the business enterprise approach
- Hotel Management, Intangible Assets in Hotel Property Tax Assessments
- Lincoln Institute of Land Policy, Removing Personal Property and Intangibles from Hotel Valuations
- Counselors of Real Estate, Appraising Real vs. Personal Property; George R. Mann, FF&E, FIRREA vs. USPAP
- Uniform Standards of Professional Appraisal Practice, 2024 edition, The Appraisal Foundation
- Interagency Appraisal and Evaluation Guidelines, federal banking agencies
- Rushmore and O'Neill, Updated Benchmarks for Projecting Fixed and Variable Components of Hotel Financial Performance, Cornell Hospitality Quarterly, 2015
- STR HOST Study, full-service and limited-service gross operating margins for 2009, 2010
- CBRE Hotels Research, Operating Observations from 2020, 2021
- CBRE Hotels Research, Labor Cost Trends in 2020, 2021
- CBRE Hotels Research, Hotels Owners Interested in Interest, 2021
- CBRE Hotels Research, U.S. Real Estate Market Outlook 2023, Hotels
- CBRE Hotel Horizons, RevPAR recovery by chain scale, November 2022
- Kalibri Labs, RevPAR recovery index by chain scale, 2022
- HotStats, At What Occupancy Rate Can a Hotel Break Even, and How Rooms-Only Business Impacts a U.S. Break-Even Analysis, 2020
- Trepp, Navigating the Lodging Sector CMBS Delinquencies: The Emerging CapEx Challenge, 2025
- KBRA, Lodging Loan Performance Clouded by Upper Upscale Chains, April 2023
- CoStar Group, United States Hospitality National Report, September 2026, licensed to MMCG Invest
- Apers, Full-Service vs. Select-Service vs. Limited-Service Hotel Operating Models; Hotel Management Agreements
- Wells Fargo Commercial Mortgage Securities and Deutsche Mortgage and Asset Receiving Corp., CMBS offering documents, FF&E reserve ramp terms, 2018 and 2023
- NAGGL, Coleman Report and Doeren Mayhew, published summaries of SOP 50 10 8.1, August 2026
- MMCG Invest, The SBA Feasibility Study Requirement That Does Not Exist (and the Ones That Do), August 2026

Michal Mohelsky, J.D., FMVA, Practicing Affiliate of the Appraisal Institute
Principal, MMCG Invest, LLC
Published September 12, 2026. How this analysis was prepared.
Cite this
Michal Mohelsky, J.D., FMVA (2026). Why Almost Every SBA Hotel Loan Is a Limited-Service Hotel. MMCG Invest, LLC. https://www.mmcginvest.com/post/why-almost-every-sba-hotel-loan-is-a-limited-service-hotel
Where this goes next
- Hotel Feasibility StudyMMCG's feasibility study page for this subject.