Summary
The small drive-thru unit is at once the most productive and the most expensive real estate per square foot in the category, and no published research yet prices what a vacated box under 1,600 square feet is worth. Taco Bell's Go Mobile design measures as little as 1,325 square feet against roughly 2,500 for the traditional box, yet the 2026 franchise disclosure still puts a new traditional restaurant at $1,859,750 to $4,312,200, excluding the land.
Kitchen infrastructure alone runs 30 to 40 percent of the construction budget, which is why Krystal's drive-thru only prototype cut the building 56 percent while the kitchen shrank 20 percent. Spread Taco Bell's $2,304,197 median unit revenue across the traditional 2,500 square foot box and the unit produces about $922 per square foot, and across the original 1,325 square foot spec, roughly $1,739.
Written for Lenders underwriting QSR construction loans, Franchisees sizing a new build, Net lease investors buying drive-thru pads. 28 minute read.
Key figures
- Total initial investment, new traditional Taco Bell restaurant, excluding land
- $1,859,750 to $4,312,200
- Taco Bell Franchisor, LLC Franchise Disclosure Document, issued March 20262026 filing
- Median unit revenue, Taco Bell
- $2,304,197
- Taco Bell Franchisor, LLC Franchise Disclosure Document, issued March 2026Fiscal 2025
- Ground-up freestanding QSR construction cost
- $450 to $555 per gross square foot
- Terrapin Construction Group and EB3 Construction QSR cost benchmarks, cited as (13)(14)2026 national midpoint
- Kitchen plus mechanical, electrical and plumbing share of hard cost
- 45 to 55 percent
- 2026 contractor and cost-consultant benchmarks cited as (13)2026
- Asking cap rate, franchisee-guaranteed QSR
- 6.85 percent
- The Boulder Group, Single Tenant Net Lease Research Report Q2 2026Second quarter 2026
- Charge-off rate, limited-service restaurants, resolved 7(a) loans
- around 18.9 percent
- SBA 7(a) FOIA loan-level data as analyzed by PeerSense, Loan Analytics and franchisefailurerates.com, cited as (39)Resolved cohort, statuses through mid-2026
The quick-service restaurant is disappearing into its own kitchen. MMCG pulled the tenant records on seven national brands, the franchise disclosure documents behind them, and the 2026 cost data underneath, and found a development math problem most credit memos have not caught up with: the building shrank, the check did not, and cost per square foot quietly inverted.
Somewhere between 2020 and today, the American fast-food restaurant stopped being a restaurant in the ordinary sense. It became a production facility with a queue attached. The dining room, the part of the building that gave the category its name, is being engineered out one prototype at a time. Taco Bell's Go Mobile design measures as little as 1,325 square feet against roughly 2,500 for the brand's traditional box (2)(3). Del Taco's drive-thru-only Fresh Flex unit is 1,152 square feet (26). Krystal's carryout prototype cut the building from 2,700 square feet to 1,200 (12). Dutch Bros builds coffee shops of roughly 900 square feet with no customer seating at all (31).
Here is what did not shrink: the cost. Taco Bell's 2026 franchise disclosure puts the total initial investment for a new traditional restaurant at $1,859,750 to $4,312,200, excluding the land (2). The kitchen, the hoods, the walk-ins, the fryers, the drive-thru technology stack, the grease interceptor, the transformer, none of it goes away when the tables do. So the arithmetic every lender should be running is simple and uncomfortable. Divide a nearly unchanged project cost by a much smaller denominator and the cost per square foot climbs. Divide the sales by the same shrinking denominator and sales per square foot climbs even faster. The 1,300 square foot drive-thru box is simultaneously the most productive and the most expensive real estate, per foot, in the history of the category.
This article lays out the evidence: a seven-brand footprint dataset MMCG computed from CoStar tenant company records, the franchise disclosure ground truth on what these buildings cost, the mechanics of why the cost curve inverted, and the underwriting consequences, from occupancy cost math to the second-generation collateral question that, as far as we can find, nobody in the published research has priced.
| Format | Building SF | Lot required | Drive-thru lanes |
|---|---|---|---|
| Traditional | ~2,500 | ~0.75 acre | 1 (0 digital) |
| Cantina | Not disclosed | Not disclosed | 0 |
| Go Mobile | 1,325 to 1,600 | ~0.50 acre | 2 (1 digital) |
| Defy | 3,000 (two storeys) | Not disclosed | 4 (3 digital) |
| Express | Not disclosed | Not disclosed | Not disclosed |
One brand, five buildings
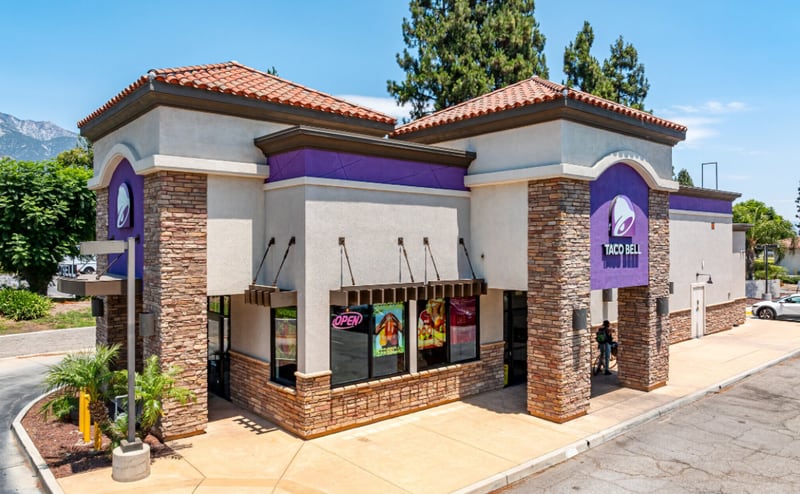
Taco Bell is the cleanest specimen in the category because it runs its whole architectural history at once. The traditional freestanding unit, the direct descendant of the mission-style boxes Glen Bell started building in 1962, still averages about 2,500 square feet with a dining room and a single drive-thru lane (2)(3). The Cantina format strips the drive-thru and moves the kitchen behind glass in urban in-line space. Go Mobile, announced in August 2020, went the other way: 1,325 square feet in the original spec, roughly 1,600 in the version that opened in El Paso in early 2023, two drive-thru lanes with one reserved for mobile-order pickup, a walk-up window, and effectively no dining room (3)(4). The company's own development team has said the format fits on half-acre lots, against three-quarters of an acre for a traditional unit (4).
Then there is Defy, the two-story flagship a franchisee opened in Brooklyn Park, Minnesota in June 2022: 3,000 square feet stacked vertically, four drive-thru lanes, three of them dedicated to mobile and delivery pickup, with food descending from the second-floor kitchen by a proprietary lift (5). In the 2023 drive-thru benchmarking that followed, the unit averaged about 176 seconds from arrival to handoff, short of the two-minute target its designers set but far ahead of the field (6). Defy remains a single flagship rather than a rollout, and that is instructive too. The system is not betting on bigger, taller, or more theatrical. It is betting on smaller.
The bet is working on the demand side. Taco Bell grew average unit volumes from $1.6 million in 2019 to about $2.2 million in 2024, and the 2026 disclosure reports median unit revenue of $2,304,197 for fiscal 2025 (2)(8). The parent's stated plan targets $3 million volumes by 2030 (8). Digital mix reached 47 percent of United States sales in mid-2025 and was approaching half by early 2026 (9). The customers did not leave. They just stopped coming inside.
The footprint dataset: seven brands, one direction
To measure the box rather than the brand narrative, we pulled the CoStar tenant company records for seven national QSR systems on August 25, 2026 and divided occupied square footage by tracked locations (1). The result is a metric we have not seen published anywhere else: the average footprint per tracked property, brand by brand.
| Brand | Tracked locations | SF occupied | SF per tracked property | CoStar credit score | Growth flag |
|---|---|---|---|---|---|
| Taco Bell | 8,632 | 19,715,511 | 2,284 | B-60 (Low Risk) | Growing |
| Del Taco | 552 | 1,337,969 | 2,424 | B-51 (Low Risk) | Growing |
| Popeyes | 3,781 | 9,357,979 | 2,475 | C-50 (Moderate Risk) | Growing Rapidly |
| Jack in the Box | 2,706 | 6,814,867 | 2,518 | D-24 (High Risk) | Downsizing |
| KFC | 5,877 | 15,043,644 | 2,560 | B-53 (Low Risk) | Stable |
| Wendy's | 6,306 | 18,204,557 | 2,887 | n/a in pull | Downsizing |
| Burger King | 8,297 | 24,592,380 | 2,964 | B-66 (Low Risk) | Stable |
Source: CoStar tenant company records, pulled August 25, 2026; MMCG computation (1).
Read the column and the industry's architecture sorts itself. The Mexican-menu brands and the chicken brands, whose prototypes were redrawn most recently, average 2,284 to 2,560 square feet per tracked property. The legacy burger systems, whose fleets carry decades of 1990s-era dining rooms, sit 400 to 700 square feet higher. Taco Bell, the brand shipping 1,325 to 1,600 square foot prototypes into a fleet that still averages 2,284, is watching its own average fall in real time: every Go Mobile opening drags the mean down. The burger systems are on the same slope, just further behind: Wendy's now builds every new United States unit on its 2,385 square foot Global Next Gen design, more than 10 percent smaller than the box it replaced (18)(19).
Three data cautions belong in print, because we hold our own dataset to the same standard we hold anyone else's. First, these are CoStar-tracked properties, not brand operating counts, and the two diverge for good reasons: property databases retain closed, dark, relocated, co-branded and non-traditional sites that operating rolls drop. Taco Bell's own 2026 disclosure lists 7,998 United States units (2), against 8,632 tracked properties; Burger King's operating count is roughly 6,650 against 8,297 tracked, a gap consistent with several hundred closures a year since 2023 plus the roughly 1,022-unit Carrols portfolio the parent acquired in May 2024 (20)(22). KFC is the extreme case: about 3,490 United States operating units per the 2026 disclosure (17) against 5,877 tracked properties, a spread that reflects express counters, co-branded KFC and Taco Bell units, and an elevated closure run of roughly 200 units across 2025 and early 2026 (7)(17). Use the franchisor count for market sizing and the property count for what it actually measures, which is real estate.
Second, the credit column deserves respect precisely because it is unglamorous. The two fastest-growing systems in the table carry the weakest scores (Popeyes at C-50, Del Taco at B-51), while the stable legacy systems score better. Growth and credit are not the same underwriting question, and the net-lease market prices that distinction to the basis point, as we will see.
Third, one ownership correction that stale databases will get wrong for another year: Del Taco no longer belongs to Jack in the Box. The sale to Yadav Enterprises closed December 22, 2025 for approximately $119 million, about $109 million in cash plus a short-term note, ending a three-year ownership that began at roughly $585 million (25). Any tenant record still showing the old parent is out of date, and any lender underwriting Del Taco exposure is now underwriting a private, unrated franchisor.
| Brand | Tracked properties | SF occupied | SF per property | Franchisor US units | Credit | Growth |
|---|---|---|---|---|---|---|
| Taco Bell | 8,632 | 19,715,511 | 2,284 | 7,998 | B-60 | Growing |
| Del Taco | 552 | 1,337,969 | 2,424 | ~575 | B-51 | Growing |
| Popeyes | 3,781 | 9,357,979 | 2,475 | 3,229 | C-50 | Growing rapidly |
| Jack in the Box | 2,706 | 6,814,867 | 2,518 | 2,128 | D-24 | Downsizing |
| KFC | 5,877 | 15,043,644 | 2,560 | ~3,490 | B-53 | Stable |
| Wendy's | 6,306 | 18,204,557 | 2,887 | 5,933 | Not in pull | Downsizing |
| Burger King | 8,297 | 24,592,380 | 2,964 | 6,650 | B-66 | Stable |
What the box actually costs in 2026
The franchise disclosure documents are the only place the whole check is itemized in public, and the 2025 and 2026 filings tell a consistent story once the format labels are kept straight.
| Brand | FDD vintage | Total initial investment (Item 7) | Reported unit revenue (Item 19) |
|---|---|---|---|
| Taco Bell, new traditional | 2026 | $1,859,750 - $4,312,200 | $2,304,197 median, FY2025 |
| Taco Bell, in-line or end-cap | 2026 | $934,750 - $1,815,200 | see above |
| KFC, new build | 2026 | $2,107,575 - $4,155,000 | $1,346,365 system average, FYE2024 |
| Wendy's | 2025 | $1,580,457 - $3,105,000 | $2,108,454 average, FY2024 |
| Burger King, all formats | 2026 | $348,400 - $3,320,600 | $1,692,549 traditional average, FY2025 |
| Popeyes, freestanding | 2025 | $1,222,045 - $3,923,245 | $1,974,468 average, FY2024 |
| Jack in the Box, traditional | 2026 | $1,909,500 - $4,041,500 | $1,913,335 systemwide, FY2025 |
| Del Taco, new franchised | 2025 | $1,497,200 - $3,321,000 | pre-sale disclosure |
Source: brand franchise disclosure documents, 2025-2026 vintages as labeled; ranges generally exclude real estate (2)(17)(18)(20)(23)(24)(26).
Two footnotes matter more than the table. Nearly every one of these ranges excludes land, which means the published ceiling is not the project ceiling: a fee-simple site in a decent corridor adds high six to low seven figures before the first yard of concrete, and more than 68 percent of net-lease QSR pads now sit on ground leases precisely because operators would rather capitalize the dirt at 5 to 7 percent of land value than buy it (35). And Burger King's 2026 filing cut its high end by roughly $1.4 million from the 2025 filing, from $4,730,500 to $3,320,600, a real revision that tracks the system's pivot from large ground-up builds toward remodels and conversions under its $700 million image program (20)(22). Remodels are their own budget line: the brand's largest franchisee disclosed remodel costs of $800,000 to $1,700,000 per restaurant, averaging about $1.3 million (21). And McDonald's is the reminder of why format labels matter: its disclosed range of $1,472,000 to $2,807,000 looks modest only because the franchisor controls the real estate and charges rent of roughly 8 to 15 percent of sales on top of royalties, so the largest recurring cost in the system never touches the disclosure table (27).
Underneath the disclosure ranges sits the hard-cost engine. Ground-up freestanding QSR construction is running roughly $450 to $555 per gross square foot at the 2026 national midpoint, with a floor near $275 in low-cost Sun Belt metros and a ceiling of $750 or more on the coasts (13)(14). Escalation is running about 5 percent a year: the Turner index printed a 5.15 percent annual gain in the second quarter of 2026, and the ENR building index 4.3 percent (15)(16). The drive-thru itself, the whole point of the small box, adds $75,000 to $200,000 of sitework beyond the building, plus $27,000 to $75,000 of order-point and menu-board equipment per lane, before the canopy (14). And the municipal fee schedule leans on the format hard: the fast-food-with-drive-thru land use code generates 467.48 daily trips per 1,000 square feet in the traffic engineers' manual, one of the highest rates in the book, which is why transportation impact fees hit a small drive-thru QSR harder per square foot than almost any other commercial use (33).
| Brand and format | FDD | Item 7 low | Item 7 high | Unit revenue | Cost to sales |
|---|---|---|---|---|---|
| Popeyes, in-line | 2025 | $504,545 | $1,968,245 | $1,974,468 | 0.26x to 1.00x |
| Taco Bell, in-line or end-cap | 2026 | $934,750 | $1,815,200 | $2,304,197 | 0.41x to 0.79x |
| Popeyes, freestanding | 2025 | $1,222,045 | $3,923,245 | $1,974,468 | 0.62x to 1.99x |
| Del Taco, new franchised | 2025 | $1,497,200 | $3,321,000 | $1,613,899 | 0.93x to 2.06x |
| Wendy's | 2025 | $1,580,457 | $3,105,000 | $2,108,454 | 0.75x to 1.47x |
| Taco Bell, new traditional | 2026 | $1,859,750 | $4,312,200 | $2,304,197 | 0.81x to 1.87x |
| Jack in the Box, traditional | 2026 | $1,909,500 | $4,041,500 | $1,913,335 | 1.00x to 2.11x |
| KFC, new build | 2026 | $2,107,575 | $4,155,000 | $1,346,365 | 1.57x to 3.09x |
| Burger King, all formats | 2026 | $348,400 | $3,320,600 | $1,692,549 | see freestanding |
| Burger King, freestanding | 2026 | $2,249,200 | $3,320,600 | $1,692,549 | 1.33x to 1.96x |
The inversion: why smaller costs more per foot
The intuition that a half-size building should cost half as much dies in the kitchen. In quick service, the kitchen and the mechanical systems that serve it are the building: kitchen infrastructure alone runs 30 to 40 percent of the construction budget, and kitchen plus mechanical, electrical and plumbing together absorb 45 to 55 percent of hard cost (13). Those systems are sized to throughput, not to floor area. A restaurant designed to push $2.3 million of tacos through two drive-thru lanes needs the same hood runs, the same fire suppression, the same walk-ins, the same grease interceptor, and frequently a larger technology package than its dine-in ancestor, because the digital lanes come with screens, sensors, and a second order point.
The cleanest natural experiment in the public record is Krystal's. When the chain designed its drive-thru-only prototype, the building shrank 56 percent, from 2,700 square feet to 1,200. The kitchen shrank 20 percent (12). Taco Bell's Go Mobile has been described, accurately, as mostly a kitchen (3). Remove the dining room and you have removed the cheapest square footage in the building, the part with tables, chairs and drywall, while keeping nearly all of the expensive core. The fixed core divided by fewer square feet is the whole inversion in one fraction.
The sales side inverts even harder, and this is the number that should reframe how appraisers and lenders read these assets. Take Taco Bell's $2,304,197 median unit revenue (2). Spread it across the traditional 2,500 square foot box and the unit produces about $922 per square foot. Across the 1,600 square foot Go Mobile, $1,440. Across the original 1,325 square foot spec, roughly $1,739. Dutch Bros, the logical endpoint of the format, reported record average unit volumes of about $2.2 million out of roughly 900 square foot shops in early 2026, which is in the neighborhood of $2,400 per square foot, from a building that costs about $1.3 million to put up (31). For calibration, appraisal literature treats $200 per square foot as the survival line for limited-service restaurants (42). These boxes are running four to twelve times that.
So the small-format QSR carries the highest cost per square foot and the highest sales per square foot in the category at the same time. Neither number is a mistake. They are the same fact seen from two sides, and any analysis that quotes one without the other, a construction bid that looks alarming per foot, or a sales figure that looks miraculous per foot, is telling half the story.
| Format | Building SF | Annual unit revenue | Sales per SF |
|---|---|---|---|
| Taco Bell traditional | 2,500 | $2,304,197 | $922 |
| Taco Bell Go Mobile, 2023 build | 1,600 | $2,304,197 | $1,440 |
| Taco Bell Go Mobile, original spec | 1,325 | $2,304,197 | $1,739 |
| Dutch Bros shop | ~900 | ~$2,190,000 | ~$2,433 |
The demand curve that built the small box
None of this is an architectural fashion. It is a response to a measurable migration of the transaction. Off-premise orders now account for more than 70 percent of quick-service transactions (11). The drive-thru share of QSR orders has actually fallen, from 83 percent in 2020 to 65 percent in 2025, not because cars went away but because digital pickup and delivery grew around them (10). Taco Bell's digital mix went from 1 percent in 2018 to 47 percent by mid-2025 (9). The dining room lost its economic function years before the architects caught up, which is why the biggest single move in existing fleets is demolishing part or all of the seating area to expand the kitchen or add pickup shelving.
Honesty requires the counterexamples, because a trend with no exceptions is usually a chart error. Raising Cane's builds roughly 3,400 to 3,800 square foot restaurants with full dining rooms and posted a $6.3 million average unit volume across 913 company-run units in 2025, the strongest sales-per-store figure of any brand its size (30). Chick-fil-A's freestanding units average $9.16 million on big boxes and big sites, though its newest Atlanta-area concept is a four-lane elevated drive-thru with no dining room and a kitchen twice normal size, which suggests where even the outlier is headed (28). Culver's, the highest-capital burger concept in the disclosure set at $3.4 million to $10.3 million all-in, keeps growing with dining rooms intact (29). The large format still works where volumes are extraordinary. The industry's middle, brands doing $1.3 million to $2.3 million a unit, cannot justify the extra thousand square feet, and the disclosure documents now price both realities side by side.
The lender's math: where the small box gets underwritten
Everything above is context. What follows is the part MMCG puts in front of credit committees.
Start with the ratio nobody prints. Divide total project cost by annual unit revenue and you get the sales-to-investment relationship that decides whether a QSR development ever pays for itself. Taco Bell's traditional range against its median revenue runs 0.8x to 1.9x cost-to-sales, tolerable at the low end, strained at the top (2). KFC's 2026 new-build range against its $1,346,365 system-average sales runs roughly 1.6x to 3.1x (17). A build that costs three years of gross revenue, before land, is not a restaurant investment problem, it is a structural warning, and it explains in one number why KFC's United States system is shrinking while its franchisor redraws the prototype. In our practice, stress rises sharply once the ratio clears about 1.7x; above that line the deal needs an exceptional site story or it needs resizing.
Back the rent out of the sales, never out of the appraisal. The institutional benchmark for QSR occupancy cost is 7.5 to 8.5 percent of sales, the band one large net-lease landlord targeted across a 586-property QSR portfolio, with realized cost of 7.4 percent and unit rent coverage of 2.63x (36). General restaurant underwriting treats 8 to 10 percent as the ceiling (37), while the median limited-service operator actually pays about 5.2 percent (11), a gap that is the lender's margin of safety. Applied to the Taco Bell median, the band supports roughly $173,000 to $196,000 of annual rent. Here is the inversion showing up in the lease: that same supportable rent is $69 to $78 per square foot on a 2,500 square foot box, and $108 to $148 per square foot on the small formats. A market-rent comparison that benchmarks a 1,400 square foot Go Mobile against conventional retail rent per foot will reject a perfectly healthy deal, or worse, approve an unhealthy one on a big legacy box where the percentage math fails. The percentage of sales is the test; the per-foot figure is only its shadow.
Size the equity to the 2025 rulebook. Under SOP 50 10 8, effective June 1, 2025, a ground-up QSR is special-purpose property, which raises the SBA 504 equity requirement from 10 to 15 percent, and a startup operator adds another 5, so the realistic injection for a new operator building a new store is 20 percent, not the 10 percent that still circulates in term sheets (38). The 7(a) program caps at $5 million, the combined 7(a) and 504 exposure cap doubled to $10 million in July 2026, and the Franchise Directory, eliminated in 2023, was reinstated with the new SOP, so brand eligibility is once again a checkbox that can stall a closing (38). The loss data explains the caution: limited-service restaurants charge off around 18.9 percent of resolved 7(a) loans, among the worst of any sector, with franchised concepts modestly better than independents (39). The brand dispersion inside that average is enormous, from 0.0 percent across more than a hundred resolved loans for Wingstop and Culver's to rates above 30 percent for the sector's failures (39). The logo on the building is a real underwriting variable. It is just not a substitute for the coverage math.
Price the exit off the guarantee, not the sign. The Boulder Group's second-quarter 2026 data puts corporate-guaranteed QSR at a 5.85 percent asking cap rate and franchisee-guaranteed QSR at 6.85 percent, a clean 100 basis point spread, with trophy ground leases for the top credits asking 4.45 percent and Taco Bell product trading around 5.25 to 5.55 (34). The spread is not sentiment. It is the market's memory of 2023 through 2026, when large multi-unit franchisees of exactly these brands, Burger King operators Meridian, Toms King and Premier Kings, a 70-unit Wendy's operator, a 57-unit Burger King operator in 2025, and the 136-unit Popeyes franchisee Sailormen in January 2026, filed one after another (40)(41). Sailormen's petition is the tutorial: $233 million of sales, an $18.8 million operating loss, more than $342 million of liabilities, and a collapse triggered less by store-level performance than by lease guarantees on units it had already exited (40). A franchisee guarantee is worth the guarantor's diversified balance sheet and not a dollar more. The real estate has to carry itself.
| Measure | Value | Basis |
|---|---|---|
| Chick-fil-A ground lease | 4.20% to 4.50% | Asking, Q1 2026 |
| McDonald's ground lease | 4.30% to 4.60% | Asking, Q1 2026 |
| Taco Bell, franchisee guaranteed | 5.25% to 5.55% | Asking, 2026 |
| Corporate QSR benchmark | 5.85% | Asking, Q2 2026 |
| Franchisee QSR benchmark | 6.85% | Asking, Q2 2026 |
| Short-term or unrated tenant | 6.45% to 7.45% | 200 to 300 bps wide of trophy ground lease |
| Median realized occupancy cost | 5.2% of sales | Limited-service operators, 2024 data |
| Institutional QSR portfolio, realized | 7.4% of sales | 586-property portfolio disclosure |
| Institutional target band | 7.5% to 8.5% | Portfolio target |
| Underwriting ceiling | 8% to 10% of sales | Standard restaurant underwriting |
| Supportable rent, 2,500 SF box | $69 to $78 per SF | $2,304,197 revenue at 7.5% to 8.5% |
| Supportable rent, 1,600 SF box | $108 to $122 per SF | Same revenue, smaller denominator |
| Supportable rent, 1,325 SF box | $130 to $148 per SF | Same revenue, smaller denominator |
The collateral question nobody has priced
Now put the two halves together, the shrinking single-purpose box and the franchisee credit behind it, and you reach the question a feasibility study has to answer before a construction loan closes: what is this building worth on the day the tenant is not in it?
For the conventional second-generation drive-thru box, the 2,000 to 4,400 square foot vintage on a full pad, the market's answer is reassuring. Landlords report strong demand to backfill dark restaurant space, sometimes at meaningfully higher rents (43), and a like-for-like restaurant re-tenanting costs roughly half of a ground-up build and takes a third of the time (13)(43). Chipotle taking over a former KFC is now an ordinary transaction, and Chipotle itself puts a drive-thru lane on more than 80 percent of its new units (32), which keeps the buyer pool for used drive-thru pads deep.
The sub-1,600 square foot generation is a different asset. It has no dining room to give a second user options, a kitchen engineered to one brand's line, and a site plan where the building is small but the land commitment is not, because the queuing is the real program: municipal stacking codes demand on the order of 150 feet of lane, or four or more stacking spaces per lane plus an escape lane, and those requirements do not shrink with the building (33). The realistic backfill pool narrows to other drive-thru-native operators, coffee, chicken fingers, beverage concepts, and here is the finding that we consider the most important sentence in this study: we can locate no published research quantifying the re-tenanting discount for a vacated drive-thru-only box under 1,600 square feet. The dataset does not exist yet because the buildings are too young to have failed in numbers. That silence is not comfort. It is the definition of unpriced risk, and until the evidence arrives, the defensible posture is to underwrite these as single-purpose collateral: appraise them with a cost approach that respects the kitchen density, haircut the residual, and require the dark-value stress case in writing.
The same logic runs through the land. More than two-thirds of QSR pads now sit on ground leases, with credit-tenant ground rent capitalizing at 4.5 to 5.5 percent of land value and franchisee-grade rent at 7 to 11 percent (35). The ground lease is the small format's natural habitat, it keeps the check down and matches the asset's specialization, but a leasehold loan on a 1,400 square foot single-purpose building is the far end of the collateral spectrum, and the pricing should say so.
| Measure | Traditional, 2,500 SF | Go Mobile, 1,600 SF | Change |
|---|---|---|---|
| Building footprint | 2,500 SF | 1,600 SF | -36.0% |
| Site area required | 0.75 acre (32,670 SF) | 0.50 acre (21,780 SF) | -33.3% |
| Site area per 1,000 SF of building | 13,068 SF | 13,613 SF | +4.2% |
| Second-generation conversion cost | About 50% of a ground-up build | -50% | |
| Second-generation delivery timeline | About one third of a ground-up build | -67% |
How MMCG analyzes the small box
A lender-grade feasibility study for a 2026 QSR development, the kind MMCG prepares for SBA, USDA and conventional credit files, states its cost basis as an AACE Class 4 estimate with a minus 30 to plus 50 percent accuracy band, escalates to the midpoint of construction at roughly 5 percent a year with an 8 percent stress case, and reconciles the franchisor's Item 7 range against a Marshall & Swift CoreLogic build-up localized by city cost index, because a national dollar-per-foot number is off by a third in either direction before the first bid arrives (13)(15)(16). It derives supportable rent from disclosed unit revenue at the 7.5 to 8.5 percent occupancy band, confirms coverage above 2.0x with a stress floor at 1.5x, tests cost-to-sales against the 1.7x line, sizes SBA equity to the special-purpose rules, and prices the exit at the franchisee cap rate unless the guarantee genuinely earns better. That is the whole discipline in one paragraph: the small box is a superb operating machine and a demanding piece of collateral, and the study's job is to hold both truths at once. Our methodology and recent MMCG engagements show how that discipline reads on paper; commissioning a lender-grade feasibility study is the fastest way to apply it to a live deal.
The quick-service restaurant spent sixty years as the most legible building in America: you could see the whole business through the window. The 2026 version has no window worth looking through, a queue instead of a lobby, and a kitchen where the dining room used to be. It earns more per square foot than the buildings it replaced, costs more per square foot than any of them, and asks its lender a question the old boxes never did. The answer is not to avoid the format. The answer is to underwrite the building that is actually being built.
Frequently asked questions
How much does it cost to build a Taco Bell in 2026? The 2026 franchise disclosure puts a new traditional restaurant at $1,859,750 to $4,312,200 excluding real estate, with in-line and end-cap formats at $934,750 to $1,815,200; the Go Mobile small format is priced inside the traditional range rather than broken out separately (2). Land, fee or capitalized ground rent, comes on top.
Why does a smaller QSR cost more per square foot? Because the kitchen and mechanical systems, 45 to 55 percent of hard cost, are sized to sales volume rather than floor area, so removing the dining room removes the cheapest square footage while keeping nearly all of the expensive core (12)(13). Krystal's drive-thru-only prototype cut the building 56 percent but the kitchen only 20 percent (12).
What occupancy cost should a lender underwrite for a QSR? Target 7.5 to 8.5 percent of gross sales, treat 8 to 10 percent as the ceiling, and note the median limited-service operator actually pays about 5.2 percent, which is the margin of safety (11)(36)(37). Derive the rent from disclosed unit revenue, then check the per-foot figure, not the other way around.
Are franchisee-guaranteed QSR properties riskier than corporate ones? The market prices them 100 basis points wider, 6.85 versus 5.85 percent asking in mid-2026, and the 2023-2026 wave of multi-unit franchisee bankruptcies across Burger King, Wendy's and Popeyes systems is the reason (34)(40)(41). Underwrite the real estate to stand without the guarantee.
What happens to a small drive-thru-only building when the tenant leaves? Conventional second-generation drive-thru boxes re-let readily, at roughly half the cost and a third of the timeline of ground-up construction, but no published research yet quantifies the discount for vacated boxes under 1,600 square feet, so prudent underwriting treats them as single-purpose collateral with a dark-value stress case (13)(43).
August 25, 2026 by Michal Mohelsky, principal of MMCG Invest, LLC, a national SBA and USDA feasibility study consultancy
Michal Mohelsky, J.D. | Principal | mmcginvest.com
Contact: michal@mmcginvest.com
Phone: (628) 225-1110
Disclaimer: This report is provided for informational purposes only and does not constitute investment, legal, or tax advice. Data presented herein is derived from proprietary MMCG databases and third-party sources believed to be reliable; however, MMCG Invest makes no representation as to the accuracy or completeness of such information. Figures from third-party industry databases have been independently verified and, where appropriate, adjusted to reflect MMCG's proprietary analytical methodology. Statutory and regulatory references are provided for context and must be verified with counsel before reliance. Past performance is not indicative of future results.
Sources
(1) CoStar Group, Tenant Company records: Taco Bell, KFC, Wendy's, Burger King, Popeyes, Jack in the Box, Del Taco; pulled August 25, 2026; per-property figures are MMCG computations on tracked properties, not brand operating counts. (2) Taco Bell Franchisor, LLC, Franchise Disclosure Document, issued March 2026 (Items 7, 19, 20), with format breakout per the 2025 filing; median unit revenue as parsed from the 2026 filing by FDD aggregators. (3) Nation's Restaurant News and Marketing Dive coverage of the Taco Bell Go Mobile announcement, August 2020 (1,325 SF specification versus ~2,500 SF traditional). (4) Restaurant Dive, Taco Bell Go Mobile El Paso opening, 2023 (1,600 SF; half-acre versus three-quarter-acre lot requirement). (5) Taco Bell and Border Foods, Taco Bell Defy opening release, PRNewswire, June 2022. (6) QSR Magazine, 2023 Drive-Thru Report, Defy timing study. (7) Yum! Brands, Inc., FY2025 Form 10-K and Restaurant Units Activity Summary, filed February 2026. (8) QSR Magazine, coverage of the Taco Bell R.I.N.G. growth plan, March 2025. (9) Yum! Brands quarterly earnings disclosures, 2025-2026 (Taco Bell digital mix and United States margins). (10) Revenue Management Solutions, drive-thru and channel-mix research, 2025. (11) National Restaurant Association, 2026 State of the Restaurant Industry (February 2026) and 2025 Operations Data Abstract (median occupancy cost). (12) Restaurant Dive, Krystal drive-thru-only prototype, 2022 (1,200 SF versus 2,700 SF; 20 percent less kitchen space). (13) Terrapin Construction Group, QSR construction cost benchmarks and second-generation conversion economics, 2026. (14) EB3 Construction, QSR and drive-thru component cost data, 2026. (15) Turner Construction, Building Cost Index, Q2 2026 release. (16) Engineering News-Record, Cost Index Review, March 2026 (Building Cost Index annual change). (17) KFC US, LLC, Franchise Disclosure Document, issued March 2026 (Items 7, 19; United States outlet counts). (18) Wendy's International, LLC, Franchise Disclosure Document, 2025 vintage, and The Wendy's Company investor disclosures, 2025-2026. (19) Schnackel Engineers, Wendy's Global Next Gen prototype engineering summary (2,385 SF). (20) Burger King Company, LLC, Franchise Disclosure Document, issued March 2026, with the 2025 filing for comparison. (21) Carrols Restaurant Group, Inc., FY2023 Form 10-K (Burger King remodel cost disclosure). (22) Restaurant Brands International, earnings disclosures 2024-2026 (Reclaim the Flame funding, remodel sales uplift, franchisee profitability, Carrols acquisition). (23) Popeyes Louisiana Kitchen, Inc., Franchise Disclosure Document, 2025 vintage (Items 7, 19). (24) Jack in the Box Inc., Franchise Disclosure Document, 2026 vintage (Items 7, 19; prototype range 1,386-2,440 SF plus 1,317 SF modular). (25) Jack in the Box Inc., press releases and SEC filings, October-December 2025 (JACK on Track; completion of the Del Taco sale to Yadav Enterprises, December 22, 2025, approximately $119 million). (26) Del Taco, LLC, Franchise Disclosure Document, 2025 vintage, and Jack in the Box FY2024 Form 10-K (Fresh Flex formats: ~1,152 SF drive-thru-only; ~2,021 and ~2,304 SF dining variants). (27) McDonald's USA, Franchise Disclosure Document, 2026 vintage, via QSR Magazine and FDD aggregators (structure and average sales; real estate corporately controlled). (28) Chick-fil-A, Inc., 2025 Franchise Disclosure Document Item 19 via QSR Magazine, April 2026, and company release on the elevated drive-thru concept, August 2024. (29) Culver Franchising System, LLC, Franchise Disclosure Document, 2026 vintage. (30) Circana, 2026 Definitive US Restaurant Rankings (2025 data), and Raising Cane's year-end 2025 disclosures. (31) Dutch Bros Inc., earnings releases and call transcripts, Q4 2025 through Q2 2026 (record AUV; build cost per shop; shop footprint). (32) Chipotle Mexican Grill, Inc., earnings releases and Chipotlane milestone announcements, 2024-2025. (33) Institute of Transportation Engineers, Trip Generation Manual, 11th Edition, Land Use Code 934, with representative municipal drive-thru stacking ordinances. (34) The Boulder Group, Q2 2026 Single Tenant Net Lease Research Report and Q1 2026 Net Lease Tenant Profiles Report. (35) JLL 2025 Net Lease Report and CBRE 2025 ground lease research (ground-lease share of QSR pads; land cap rate bands by credit). (36) VEREIT, Inc., portfolio disclosure via Form 8-K (QSR occupancy cost target 7.5-8.5 percent; rent coverage). (37) National Association of Realtors, commercial research, the occupancy cost lens (8-10 percent underwriting band). (38) U.S. Small Business Administration, SOP 50 10 8, effective June 1, 2025, with law-firm analyses (Starfield & Smith and others) of equity injection stacking, the reinstated Franchise Directory, and the July 2026 combined exposure cap. (39) SBA 7(a) FOIA loan-level data as analyzed by PeerSense, Loan Analytics, and franchisefailurerates.com (resolved-cohort charge-off rates by sector and brand, statuses through mid-2026). (40) Sailormen, Inc. Chapter 11 filings, S.D. Fla., January 15, 2026, with Franchise Times and trade coverage. (41) Nation's Restaurant News and Restaurant Business, multi-unit franchisee bankruptcy coverage, 2023-2025 (Meridian Restaurants, Toms King, Premier Kings, Starboard Group, Consolidated Burger Holdings). (42) Restaurant Resource Group, limited-service restaurant sales-per-square-foot and occupancy cost benchmarks. (43) Landlord and brokerage commentary on second-generation restaurant backfill demand and conversion economics, 2025-2026 (Phillips Edison via Bisnow and trade coverage).

Michal Mohelsky, J.D., FMVA, Practicing Affiliate of the Appraisal Institute
Principal, MMCG Invest, LLC
Published August 25, 2026. How this analysis was prepared.
Cite this
Michal Mohelsky, J.D., FMVA (2026). The New Taco Bell Is Half the Size. It Does Not Cost Half as Much. MMCG Invest, LLC. https://www.mmcginvest.com/post/the-new-taco-bell-is-half-the-size-it-does-not-cost-half-as-much
Where this goes next
- Restaurant Feasibility StudyMMCG's feasibility study page for this subject.