Summary
Build-to-suit net lease development is decided by the development spread, stabilized yield-on-cost less the exit cap rate, and in 2026 that spread is thin enough that site-specific evidence, not the tenant's logo, settles the deal. Construction costs rose roughly 29 to 32 percent above 2019 levels while single-tenant net lease cap rates expanded through twelve consecutive quarters before stabilizing at 6.80 percent.
The convention requires 100 to 200 basis points of spread, equating to a merchant-build profit margin of roughly 15 to 25 percent. A representative 2026 express car wash at $5.5 million total cost and $440,000 stabilized NOI runs an 8.0 percent yield-on-cost and an 18 percent margin at a 6.75 percent exit, but costs plus 10 percent and exit plus 50 basis points thin that margin to roughly 3 percent. Construction lenders size to the stabilized takeout, testing a debt service coverage ratio of 1.20x to 1.30x and a debt yield of 8 to 10 percent, and they value the collateral as leased and as dark.
Written for Construction lenders and credit officers, Merchant developers of net lease product, Net lease and 1031 exchange buyers, SBA 504 borrowers building owner-occupied sites. 28 minute read.
Key figures
- Single-tenant net lease cap rate
- 6.80 percent after twelve consecutive quarters of expansion
- The Boulder Group net lease research and CBRE U.S. Net Lease Investment FiguresQ1 2026
- Turner Building Cost Index
- 1156 in 2019 to 1530, a cumulative increase of roughly 29 to 32 percent
- Turner Construction Company, Turner Building Cost Index, cited as (8)2019 to Q1 2026
- U.S. net lease investment volume
- $51.4 billion, up 16 percent year-over-year, with $16.0 billion in the fourth quarter
- CBRE U.S. Net Lease Investment Figures, cited as (6)(7)full-year 2025
- Sale-leaseback market
- 714 transactions and roughly $14.4 billion
- SLB Capital Advisors, U.S. Sale-Leaseback Market Review, cited as (16)full year 2025
- Retail CMBS loss severity
- 46.6 percent, the highest of the core property types
- Fitch Ratings CMBS Loan Loss Study, cited as (23)historical loss experience
MMCG Invest, LLC | Feasibility Study Consultants | July 7, 2026
The single-tenant net lease sector has always marketed itself on simplicity: one tenant, one lease, no landlord responsibilities, a bond wrapped in brick. That simplicity is real for the investor who buys a stabilized asset. It does not exist for the developer who builds one, or for the construction lender who finances the eighteen months between a dirt lot and a rent commencement date. Between 2022 and 2025, the economics of ground-up net lease development were squeezed from both ends at once: construction costs rose roughly 29 to 32 percent above 2019 levels (8), while exit cap rates expanded through twelve consecutive quarters (1). The development spread, the margin between stabilized yield-on-cost and the exit cap rate that has historically compensated merchant builders for construction and lease-up risk, compressed toward zero on marginal deals.
That spread has now partially rebuilt. Cost escalation has moderated into the 3.6 to 4.9 percent annual range (8)(9), single-tenant cap rates have stabilized at 6.80 percent (1), and new build-to-suit leases carry rent escalations that lift stabilized income. But the market that emerged from the correction prices risk very differently than the one that entered it. Tenant credit is bifurcated. Residual real estate value, not tenant name, increasingly anchors lender recovery analysis. And the feasibility question, whether a specific building for a specific tenant on a specific corner pencils at today's costs and today's exit pricing, has become the gating item in the construction credit file.
This report examines the full arc: what it costs to build the eight dominant net lease prototypes in 2026, how the yield-on-cost spread collapsed and where it stands, what construction lenders now require, and where the residual value risks concentrate. The analysis draws on institutional research, company filings, court records, and the MMCG database.
I. Performance: The Development Spread Through a Full Cycle
The defining metric of build-to-suit feasibility is not the cap rate and not the construction cost. It is the difference between them, expressed as the development spread: stabilized net operating income divided by total project cost (yield-on-cost), minus the exit cap rate at which the completed asset trades. The market convention has long required 100 to 200 basis points of spread on pre-leased single-tenant product, equating to a merchant-build profit margin of roughly 15 to 25 percent, to compensate for entitlement, construction, and execution risk (3).
Both components of that spread moved against developers simultaneously. On the cost side, the Turner Building Cost Index rose from an annual average of 1156 in 2019 to 1530 in Q1 2026 , a cumulative increase of roughly 29 to 32 percent, with the sharpest single-year escalation of 8.0 percent recorded in 2022 (8). Mortenson's index showed year-over-year escalation still running at 6.77 percent in Q1 2026 , with materials up 9.1 percent within Q4 2025 as tariff effects settled into metals pricing as a structural rather than temporary cost (9). Tenant-side confirmation is even starker: Dollar General's chief executive told investors in mid-2025 that the cost to build a new store had risen more than 40 percent since 2019 (12).
On the exit side, single-tenant net lease cap rates expanded from a Q4 2022 retail trough near 5.95 percent asking (Northmarq's transaction-based retail series bottomed at 5.60 percent) through twelve consecutive quarterly increases, reaching a blended 6.80 percent by Q1 2026 , with retail at 6.55 percent , office at 7.90 percent, and industrial at 7.15 percent (1)(3). A deal underwritten in 2021 to a 7.0 percent yield-on-cost against a 5.5 percent exit carried 150 basis points of cushion. Run the same prototype through 2023 delivery: a 10 percent cost overrun and 80 basis points of cap rate expansion consumed the entire margin. This is not a hypothetical; it is the arithmetic that stalled speculative net lease starts across 2023 and 2024.
The spread between net lease cap rates and the 10-year Treasury tells the same story from the capital markets side. The spread stood at an unusually wide 452 basis points at the end of 2021, when the 10-year closed the year at 1.5 percent, then compressed to roughly 224 basis points at its tightest in late 2023 as Treasury yields surged faster than cap rates could reprice (6). More consequential for transaction volume was a different gap: with construction and acquisition debt pricing above 7 percent against sub-7 percent cap rates, financed buyers faced negative leverage from late 2022 through 2024, leaving all-cash and 1031 exchange buyers to set the market. By Q4 2025 the Treasury spread had rebuilt to 276 basis points , comfortably inside the 200 to 300 basis point band that has historically defined fair pricing (6).
Interactive line chart: STNL cap rate vs. 10-year Treasury yield and the resulting spread, quarterly, 2019-2026, with the negative leverage window shaded
The recovery in the development spread rests on four legs: moderating cost escalation, cap rate stabilization, higher rents on newly signed leases, and the July 2025 permanent restoration of 100 percent bonus depreciation, which added a tax-driven bid for equipment-intensive product. None of these legs restores 2021 economics. They restore a functioning market with thinner, more selective margins, and that selectivity is precisely where independent feasibility analysis earns its place in the credit file.
II. Supply: What the Eight Prototypes Cost to Build in 2026
Net lease development is not one business. It is at least eight, each with its own cost structure, land appetite, and equipment load. Blended assumptions are where pro formas go to fail ; the figures below, drawn from construction cost indices, franchise disclosure documents, investor filings, and contractor cost guides, should be treated as directional midpoints requiring site-specific verification (10)(11).
Quick-service restaurant pads (2,200-3,500 SF). Hard costs for freestanding drive-thru QSR run roughly $535 to $850+ per square foot , the highest per-foot figure in the set, because commercial kitchen, ventilation, and grease infrastructure absorb 30 to 40 percent of the budget. All-in project costs including land commonly reach $2 to $4 million . Site requirements run 0.75 to 1.65 acres; Chick-fil-A's average site is 1.63 acres with ground rent averaging approximately $101,000 per acre.
Dollar stores (8,000-10,500 SF) . The volume leader remains the cheapest box to build. Dollar General's current prototype averages roughly 9,100 SF on one acre and costs approximately $500,000 to open including capex and inventory, against a stated 17 percent average portfolio return target (12). New 2026 builds shift toward a larger 8,500 SF rural format, and because build costs will not return to 2019 levels, the company is leaning into adaptive reuse of vacated drugstore boxes.
Express tunnel car washes (100-180 ft tunnels). Total investment runs $3.85 million to well over $10 million for state-of-the-art sites, with a broader market range of $2.6 to $7 million. Equipment alone (conveyor, arches, dryers, chemical and water reclaim systems) runs $1.4 to $2.1 million , and regional cost data place car wash construction at $250 to $400 per square foot (11). The equipment intensity that inflates the budget is the same characteristic that makes the format the single most tax-efficient net lease asset under restored bonus depreciation.
Medical and dental outparcels. Clinic construction runs $350 to $800+ per square foot depending on subformat, with imaging and ambulatory surgery at the top of the range due to shielding, medical gas, and infection-control requirements. Second-generation conversions carry a frequently under-budgeted trap: undersized existing electrical service that forces MEP rework.
Convenience stores with fuel. A representative full gas station and c-store project runs approximately $6 million , with hard costs near $730 per square foot of built area including canopy and roughly $1.14 million in dispensers, underground storage tanks, point-of-sale, and refrigeration. Large-format travel centers (Buc-ee's prototypes exceed 74,000 SF with up to 120 fueling positions) represent builds in the tens of millions.
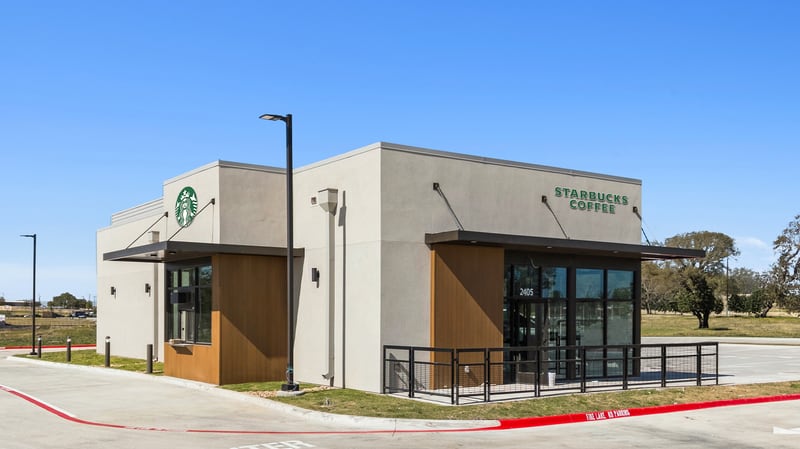
Coffee drive-thrus (500-2,500 SF). Drive-thru-only builds run $450,000 to $950,000 in vertical cost. Dutch Bros reported average capex per shop of $1.3 million in Q4 FY2025, down from $1.8 million a year earlier, a reduction management attributed explicitly to its shift toward build-to-suit structures in which the developer, not the operator, funds vertical construction (13). Scooter's Coffee discloses total investment of $794,000 to $1,341,500 for a 664 SF kiosk.
Auto parts (6,000-8,000 SF). O'Reilly's typical budget to build, open, and fixture a new owned store is approximately $3 million on 0.7 to 0.8 acre parcels. Rising land and construction costs are pushing both O'Reilly and AutoZone toward adaptive reuse of former drugstore boxes, cheaper and faster than ground-up.
Small-format grocery (15,000-25,000 SF). Aldi anchors the category with a disciplined, standardized prototype and a $9 billion U.S. investment program through 2028, including a modular format first trialed in Florida in September 2025 and designed for urban infill and conversion work (14).
Bar chart: hard construction cost per SF and representative total project cost by asset type, eight prototypes, with equipment share highlighted for car wash and c-store
The supply pipeline behind these prototypes remains formidable. Dollar General plans approximately 450 new stores in 2026 on top of nearly 21,000 existing, with roughly 11,000 future sites identified (12). Aldi has announced 180+ stores for 2026 , entering Colorado (14). Dutch Bros plans at least 181 new shops against a 2,029-store target by 2029 (13). Seven & i Holdings plans approximately 1,300 new large-format 7-Eleven stores in North America by fiscal 2030. Whistle Express became the largest U.S. express car wash operator at 530+ locations following its $385 million acquisition of Take 5 Car Wash from Driven Brands (15). Every one of those units is a build-to-suit mandate, a ground lease, or a sale-leaseback in waiting.
III. Regional Dynamics: Where the Pipeline and the Fallout Concentrate
Expansion and contraction are not evenly distributed, and feasibility work is local by definition. Three regional patterns stand out in the current cycle.
First, the growth vectors point south and west. Texas and the broader Sun Belt continue to absorb a disproportionate share of QSR, car wash, and c-store development , supported by population inflows, available pad sites, and comparatively predictable entitlement timelines; regional cost benchmarks used throughout this report reflect that concentration (11). Aldi's westward push into Colorado and its conversion program across acquired Southeastern Grocers locations in Florida and the Southeast illustrate how expansion increasingly blends ground-up work with adaptive reuse in the same market plan (14).
Second, the contraction is regionally concentrated too. Roughly 40 percent of the approximately 2,000 Rite Aid closures landed in Pennsylvania , Michigan, and Ohio , frequently in small towns and secondary corridors where the replacement tenant pool is thinnest. For developers, those same markets now offer a supply of fee-simple drugstore boxes at a fraction of replacement cost, which is exactly why Dollar General, Dollar Tree, and O'Reilly have become the most active backfill users of former pharmacy real estate. Adaptive reuse in these corridors now competes directly with ground-up development on delivered cost, and any new-build feasibility study in an affected trade area must underwrite that competition explicitly.
Third, land basis divergence between primary-corridor pads and secondary sites has widened. Hard-corner, signalized pads suitable for QSR and coffee prototypes remain scarce and fiercely contested by expanding tenants, while commodity acreage a half-mile off the node has softened. The result is a barbell in which identical buildings carry materially different total project costs, and therefore materially different yields-on-cost, within the same submarket. Trade area delineation, not metro-level averages, determines which side of the barbell a project sits on.
IV. Demand: The Buyer Pool That Sets the Exit
The exit cap rate in every development pro forma is set by a buyer pool that has been reshaped since 2022. Net lease investment volume peaked at $92.1 billion in 2021 , collapsed roughly by half through mid-2023, and recovered to $51.4 billion in full-year 2025 , up 16 percent year-over-year, with Q4 2025 alone contributing $16.0 billion (6)(7).
Composition matters as much as volume. Private buyers accounted for 53 percent of single-tenant volume in 2025, up from 43 percent a year earlier, while listed REITs' share collapsed from roughly 17 to 18 percent to 8 percent (3). The private-buyer dominance is substantially a 1031 exchange story: Delaware statutory trust equity formation rose almost 49 percent in 2025 to roughly $8.4 billion per industry tabulations in the MMCG database, and exchange buyers, working against 45-day identification clocks, consistently pay premiums for clean, financeable, quick-closing new construction. This is the structural reason new build-to-suit product exits tighter than vintage stock.
The institutional bid has not disappeared; it has repriced. Realty Income invested $6.3 billion in 2025 at a 7.3 percent initial weighted average cash yield and guided to approximately $8.0 billion for 2026 (25). Agree Realty deployed roughly $1.55 billion at a 7.2 percent weighted average cap rate. NNN REIT posted its highest acquisition year in company history at over $900 million. These yields define the wholesale floor: a merchant builder selling to the REIT bid must clear a yield-on-cost meaningfully above the low-7s, while product suited to the 1031 retail bid can exit tighter.
Bar chart: Q1 2026 median asking cap rates by tenant sector (QSR, coffee, c-store, auto parts, dollar, drugstore, car wash, medical, grocery), with lease-term bands illustrating the 200-300 bps term premium
Within that demand, pricing is ruthlessly tiered. McDonald's and Chick-fil-A ground leases trade at 4.30 to 4.60 percent ; Wawa and 7-Eleven hold sub-5.5 percent; Dutch Bros new 15-year absolute NNN leases price below 5.25 percent; auto parts sits near 6.65 percent; dollar stores at 7.15 to 8.65 percent depending on flag and guarantee; and Walgreens , the sector's cautionary tale, carries a median asking cap rate of 8.10 percent (1)(2). Lease term is the single most powerful variable: within the same tenant, the gap between a 15-to-19-year lease and a sub-5-year lease routinely spans 200 to 300 basis points (2).
Demand-side tax policy now functions as a first-order pricing input. The permanent restoration of 100 percent bonus depreciation in July 2025 compressed car wash cap rates by roughly 25 basis points , per Northmarq, into a 6.25 to 7.25 percent trading range, with the highest-quality deals tighter still, because the format's 65 to 100 percent cost-segregation reclassification makes it the most tax-efficient asset in the sector (4). C-stores with fuel and QSR pads benefit from the same mechanics in attenuated form.
V. Investment: Developer Economics Under the New Spread
Reduced to its skeleton, the merchant-build model is three numbers: total project cost, stabilized NOI, and exit cap rate. Consider a representative 2026 express car wash: $5.5 million total cost, $440,000 stabilized NOI, a 8.0 percent yield-on-cost, sold at a 6.75 percent exit. Created value equals NOI capitalized at exit ($6.52 million) less cost, roughly $1.0 million, an 18 percent margin inside the historical 15 to 25 percent target band. Now stress it the way 2023 did: costs plus 10 percent and exit plus 50 basis points, and the margin thins to roughly 3 percent, below the level at which any rational sponsor carries entitlement and construction risk. The spread is not a formality. It is the entire business.
| Scenario | Yield-on-cost | Spread | Profit margin |
|---|
Interactive calculator: user inputs land, hard, and soft costs, rent and escalations, and exit cap rate; outputs yield-on-cost, development spread, merchant-build profit, and stress scenarios at +10% cost / +50 bps exit
Three structural observations define the current investment math.
Commodity product is a volume business, not a margin business. On a Dollar General build-to-suit, developer profit typically runs $200,000 to $300,000 per site . That margin cannot absorb a meaningful overrun on a standalone basis; the model works only as a repeat program with the tenant, standardized plans, and disciplined site acquisition. Sponsors presenting single-site dollar store pro formas with institutional return expectations are describing a business that does not exist.
Equity requirements have doubled against the prior cycle. Ground-up commercial construction now requires 25 to 35 percent cash equity at most banks, against a pre-pandemic norm nearer 10 to 20 percent, with pre-leased build-to-suits from experienced sponsors qualifying at 20 to 25 percent and first-time sponsors pushed toward 35 to 40 percent. Higher equity mechanically raises the yield-on-cost a levered developer needs to clear its return hurdle, which is why marginal sites no longer pencil even where headline spreads look adequate.
Lease structure is now part of the yield. The market norm for new build-to-suit product has shifted decisively toward 10 percent escalations every five years or 1.5 to 3 percent annually, replacing the flat primary terms that characterized prior-cycle product (2)(3). Escalations lift stabilized NOI over the hold, broaden the institutional buyer pool at exit, and function as the developer's most reliable tool for rebuilding spread without touching the cost line. A flat lease in 2026 is a self-inflicted valuation penalty.
Whether a given project clears these hurdles is an empirical question about a specific site, a specific rent, and a specific trade area. It is answerable, but only with independent market evidence, which is the analytical work a feasibility study exists to perform.
VI. Capital Markets: What Construction Lenders Actually Underwrite
The construction loan itself is interest-only and is never the binding test. What lenders underwrite at origination is the stabilized takeout, and the takeout math now governs everything upstream.
The prevailing bank structure for single-tenant retail construction in 2025-2026 sizes to the lower of 65 to 75 percent loan-to-cost and 60 to 70 percent of stabilized as-completed value, tested against a stabilized debt service coverage ratio of 1.20x to 1.30x at the permanent-loan constant and a debt yield of 8 to 10 percent , with speculative retail held to 10 percent-plus. Pricing runs roughly 300 to 500 basis points over SOFR for senior construction money; all-in construction rates reached approximately 630 basis points in Q4 2025, down from 665 a year earlier, with construction spreads remaining the widest of any collateral type (11). Recourse remains the norm during construction, with completion guarantees burning off at certificate of occupancy and converting to standard carve-outs.
Federal Reserve survey data confirm the posture: banks reported tighter-than-midpoint standards for construction and land development lending throughout 2023-2025, and the January 2026 Senior Loan Officer Opinion Survey found construction the only major category where a net share of banks still expected to tighten over 2026 (22). The 2006 interagency concentration thresholds (construction loans at 100 percent of capital, total CRE at 300 percent) continue to cap appetite at the community and regional banks that historically dominated this product, which is precisely why debt funds captured roughly 37 percent of non-agency closings in 2025.
Tenant credit drives every term. An executed lease with an investment-grade corporate guarantee supports the highest advance rates and can migrate the deal into credit-tenant-lease execution, where leverage approaches the leased-fee value and coverage tolerances fall toward 1.0x because the tenant's balance sheet, not the dirt, is the repayment source. Non-rated corporates, franchisee guarantees, and personal guarantees each step leverage down and pricing and recourse up. Two disciplines are near-universal: lenders fund on executed leases, not letters of intent , and where contract rent exceeds the appraiser's market rent, they underwrite to the lower figure, so an above-market lease does not enlarge the approvable loan.
For the owner-operator, the SBA channel remains the dominant path to ground-up construction, and it carries its own feasibility architecture. The 504 program's classic structure (50 percent bank first lien, 40 percent CDC debenture, 10 percent borrower equity) steps the injection to 15 percent for a startup or a special-purpose property and 20 percent where both apply , and the current SOP explicitly lists car washes and gas stations among special-purpose assets (21). New construction requires 60 percent owner occupancy with defined lease-out limits. Critically, SOP 50 10 8 embeds the independent feasibility study in the credit file for exactly the profile ground-up net lease projects present: startups, new construction, and special-purpose collateral where projections rather than history carry the credit (21). MMCG does not perform underwriting; it produces the independent third-party studies on which that underwriting relies, and the distinction matters because the study's value lies precisely in its independence from both the sponsor's optimism and the lender's portfolio pressures.
The SBA pathway also feeds the sector's most important lifecycle: operators build owner-occupied facilities with SBA or conventional construction debt, stabilize, and monetize through sale-leaseback into the net lease market. The sale-leaseback market recorded 714 transactions and roughly $14.4 billion in 2025 , the highest dollar volume since 2022 (16). The express car wash consolidation wave, culminating in the Driven Brands sale of its 385-unit Take 5 platform to Whistle Express for $385 million, is the canonical expression of that lifecycle (15). It is also where the sharpest feasibility risk in the sector now lives, as Section VIII details.
VII. Opportunities: Where the Spread Pencils in 2026
Four opportunity sets stand out for developers and the lenders financing them.
Bonus-depreciation formats with institutional exit demand. Car wash, c-store with fuel , and QSR product carries a demonstrable tax-driven bid through at least 2029, worth an observed 10 to 25 basis points of exit compression (4). For an equipment-heavy car wash, 25 basis points on the exit is worth roughly four points of margin on a typical budget, frequently the difference between a deal that pencils and one that does not. The caveat is absolute: the tax bid rewards the format, not the location, and saturation analysis in the specific trade area remains the gating question, particularly in Sun Belt corridors where tunnel density has tripled in five years.
Fungible boxes on hard corners. The drugstore fallout demonstrated which real estate holds value when the tenant leaves: rectangular, easily reconfigured boxes on signalized corners with generous parking. Developing dollar, auto parts, and small-grocery prototypes on superior real estate builds in a residual floor that lenders now explicitly credit. Underwriting to the dirt, not the flag, is no longer a conservative posture; it is the market posture.
Adaptive reuse arbitrage. With ground-up costs structurally 30 percent above 2019 and roughly 600 former Big Lots boxes plus hundreds of former Rite Aid and Walgreens sites available, conversion frequently delivers a tenant-ready box at 50 to 70 percent of replacement cost. Dollar General, Dollar Tree, O'Reilly, and healthcare users are executing this trade at scale. For developers, reuse is both a competitor to underwrite and a strategy to run; for lenders, it offers shorter timelines and a hard-cost basis below new-build appraisal.
The operator lifecycle, run with discipline. For operators, the SBA-financed build-to-stabilization-to-sale-leaseback sequence remains the most capital-efficient expansion engine available, converting developer economics into operating-company growth. The discipline requirement is rent: set at market with EBITDAR coverage above 2.0x, the sale-leaseback funds the next three sites; set above market to maximize proceeds, it manufactures the next Zips.
Across all four, the common thread is that opportunity has migrated from financial engineering back to real estate fundamentals: trade area demand, competitive supply, residual utility, and honest rent. Those are, not coincidentally, the four questions a lender-grade feasibility study is built to answer.
VIII. Risks: Tenant Credit, Dark Value, and the Over-Rented Lease
The 2023-2026 credit cycle rewrote the sector's risk canon, and three lessons now belong in every construction credit memo.
Tenant name is not tenant credit. Walgreens went from investment-grade landlord favorite to a sub-investment-grade credit (S&P downgraded to BB in July 2024 and BB- that December) to a private, unrated holding of Sycamore Partners in a $10 billion take-private that closed in August 2025 (19)(5). Its median asking cap rate now stands at 8.10 percent, reaching 9.25 percent for sub-5-year term (1)(2). Rite Aid liquidated entirely across two bankruptcies, rejecting hundreds of leases. Big Lots rejected the substantial majority of a 1,389-store base. Family Dollar lost its investment-grade Dollar Tree parent guarantee upon its July 2025 divestiture to private equity, and its 5-year cap rates widened to 8.40 to 8.80 percent (2)(20). Approximately $6 billion of CMBS exposure across more than 360 loans ties directly to Walgreens collateral, keeping lenders on alert as maturities approach (5). The construction lender financing a 2026 build-to-suit is underwriting a 15-year exposure; the probability that the tenant's credit profile at year 10 resembles its profile at signing is demonstrably lower than the sector's marketing suggests.
Dark value is the real collateral. When a single-tenant box goes dark, the landlord faces 6 to 18 months of downtime and re-tenanting costs commonly running 10 to 25 percent of value, with backfill rents frequently below prior contract rent. A representative box valued at $10.5 million on in-place credit-tenant income can support a dark value near $6.2 million once replacement rent, a wider cap rate, and carry costs are applied, a decline of roughly 40 percent. Loss data corroborate the gap: retail has historically carried the highest CMBS loss severity of the core property types at 46.6 percent (23). The fungibility hierarchy is now explicit. Generic boxes backfill (Dollar Tree took over 300 former Walgreens sites; Ollie's acquired 63 Big Lots leases). Special-purpose assets do not: car wash tunnels have few alternative users, and fuel sites carry underground storage tank liability with mean remediation costs of roughly $243,000 per station in the foundational EPA study, frequently exceeding $500,000 in complex cases (24).
Waterfall chart: leased fee value to dark value on a representative single-tenant box, showing deductions for market rent reset, cap rate expansion, downtime carry, and re-tenanting costs
The over-rented sale-leaseback is the sector's recurring failure mode. Red Lobster's 2014 sale-leaseback priced roughly 500 properties at a 7.9 percent cap rate to fund its private-equity acquisition, setting rents that reached approximately $191 million by 2023, and the chief executive cited above-market rents directly in the 2024 bankruptcy filing (18). Zips Car Wash filed Chapter 11 in February 2025 carrying $654 million of funded debt , much of it accumulated through sale-leasebacks, against roughly $1 million of cash, and shed $279 million of obligations through a debt-for-equity restructuring (17). The mechanics are seductive: at a 6.3 percent cap rate, every incremental dollar of annual rent adds roughly sixteen dollars of sale proceeds, an arithmetic that rewards over-renting today and defers the cost to the operating company, the net lease buyer, and ultimately the lender. The policing tools are known: EBITDAR rent coverage of 2.0x or better for non-investment-grade credits, occupancy cost below 10 percent of sales, and an independent test of contract rent against imputed market rent. A feasibility study that values the real estate at market rent and the operation at arm's-length economics is the structural antidote to the proceeds-maximizing pro forma, and the divergence between the two documents is often the single most decision-relevant number in the file.
IX. Outlook: A Selective Market, and the Document That Navigates It
The base case for 2026-2027 is a functioning but discriminating market. Cap rates have found their level: Q1 2026 recorded the first quarterly decline, a single basis point, after the long expansion, achieved despite a 10-year Treasury that touched 4.48 percent late in the quarter (1). Available single-tenant supply fell 9.8 percent quarter-over-quarter to 5,151 properties, bid-ask spreads narrowed to 23 basis points in retail, and institutional desks expect steady volume against a rate path now pricing a single Federal Reserve cut (1)(6). Construction cost escalation in the 4 to 7 percent range remains the planning assumption, with data center and advanced manufacturing demand keeping labor and electrical equipment tight (9).
Three thresholds would change the picture. A sustained 10-year Treasury above roughly 4.75 percent would reopen negative leverage and push exit assumptions wider. A return of cost escalation to 2022's 8 percent would re-compress development spreads and warrant pausing speculative starts. Conversely, a rate path that carries the 10-year sustainably below 4.0 percent would likely compress cap rates 25 to 50 basis points, re-open the financed buyer pool, and restore merchant-build volume economics across the marginal deal set.
For developers, the mandate is unchanged by the cycle but sharpened by it: build fungible real estate or tax-advantaged formats on defensible corners, lease with escalations at rents a successor tenant could pay, and hold the spread stress-tested at plus-10-percent cost and plus-50-basis-point exit. For lenders, the mandate is to underwrite the takeout, the dark value, and the rent-to-market spread before the first draw. For both, the era in which the tenant's logo substituted for analysis is conclusively over.
That is the environment in which the independent feasibility study has moved from a compliance formality to the analytical center of the transaction. A lender-grade study quantifies trade area demand against competitive supply, tests contract rent against market evidence, stresses the pro forma at the occupancy and rate scenarios the lender will actually apply, and values the collateral both as leased and as dark.
July 7, 2026, by Michal Mohelsky, J.D. Principal of MMCG Invest, LLC, feasibility study company serving feasibility studies for NNN projects.
Reach out to discuss how our methodology supports your lending or investment decision.
Michal Mohelsky, J.D. | Principal | mmcginvest.com
Contact: michal@mmcginvest.com
Phone: (628) 225-1110
Disclaimer: This report is provided for informational purposes only and does not constitute investment advice. Data presented herein is derived from proprietary MMCG databases and third-party sources believed to be reliable; however, MMCG Invest makes no representation as to the accuracy or completeness of such information. Figures from third-party industry databases have been independently verified and, where appropriate, adjusted to reflect MMCG's proprietary analytical methodology. Past performance is not indicative of future results.
Sources
(1) The Boulder Group, Q1 2026 Net Lease Market Research Report, April 2026.
(2) The Boulder Group, Q1 2026 Net Lease Tenant Profiles Report, 2026.
(3) Northmarq, U.S. Single-Tenant Net Lease Market Reports, Q1-Q4 2025.
(4) Northmarq, Car Wash Net Lease Sector Update (J. Ceresnak), August 2025.
(5) Northmarq, "Walgreens After Sycamore" (B. Feller), September 2025.
(6) CBRE, Q4 2025 U.S. Net Lease Investment Figures, February 2026.
(7) CBRE, Q1 2026 U.S. Net Lease Investment Figures, 2026.
(8) Turner Construction Company, Turner Building Cost Index, Q1 2026.
(9) Mortenson, Construction Cost Index, Q4 2025 and Q1 2026 editions.
(10) Engineering News-Record, Building Cost Index and Construction Cost Index, 2025 year-end review.
(11) Gordian / RSMeans data, Construction Cost Reports, 2025; Altus Group, U.S. CRE borrowing conditions, Q4 2025.
(12) Dollar General Corporation, Q1 FY2025 earnings call (T. Vasos) and FY2026 real estate guidance.
(13) Dutch Bros Inc., Q4 FY2025 earnings call (C. Barone), 2026.
(14) ALDI U.S., 2026 growth announcement, PR Newswire, 2026.
(15) Driven Brands Holdings Inc., Form 8-K, February 25, 2025 (sale of U.S. car wash business to Express Wash Operations, LLC).
(16) SLB Capital Advisors, U.S. Sale-Leaseback Market Review, Full Year 2025.
(17) In re Zips Car Wash, LLC, Chapter 11 (N.D. Tex., February 2025), court filings; Bloomberg Law reporting.
(18) In re Red Lobster Management LLC, Chapter 11 (M.D. Fla., 2024), court record and hearing statements.
(19) S&P Global Ratings, Walgreens Boots Alliance rating actions, July 19, 2024 and December 31, 2024; Moody's Investors Service rating actions.
(20) Dollar Tree, Inc., Family Dollar divestiture announcements and Form 8-K filings, March-July 2025.
(21) U.S. Small Business Administration, SOP 50 10 8, effective June 1, 2025, with subsequent procedural notices.
(22) Board of Governors of the Federal Reserve System, Senior Loan Officer Opinion Survey on Bank Lending Practices, January 2026.
(23) Fitch Ratings, CMBS Loan Loss Study (via BIS Papers No. 21); Trepp CMBS remittance data, July 2025.
(24) U.S. Environmental Protection Agency, Costs and Issues Related to Remediation of Petroleum-Contaminated Sites.
(25) Realty Income Corporation, Q4 and Full-Year 2025 Operating Results, February 24, 2026.

Michal Mohelsky, J.D., FMVA, Practicing Affiliate of the Appraisal Institute
Principal, MMCG Invest, LLC
Published July 7, 2026. How this analysis was prepared.
Cite this
Michal Mohelsky, J.D., FMVA (2026). Feasibility of Build-to-Suit NNN Development: Yield-on-Cost, Exit Cap Spreads, and What Lenders Actually Underwrite. MMCG Invest, LLC. https://www.mmcginvest.com/post/feasibility-of-build-to-suit-nnn-development-yield-on-cost-exit-cap-spreads-and-what-lenders-actu
Where this goes next
- Feasibility Study Company for Commercial Real Estate LendingMMCG's feasibility study page for this subject.