
The U.S. Data Center Census 2026
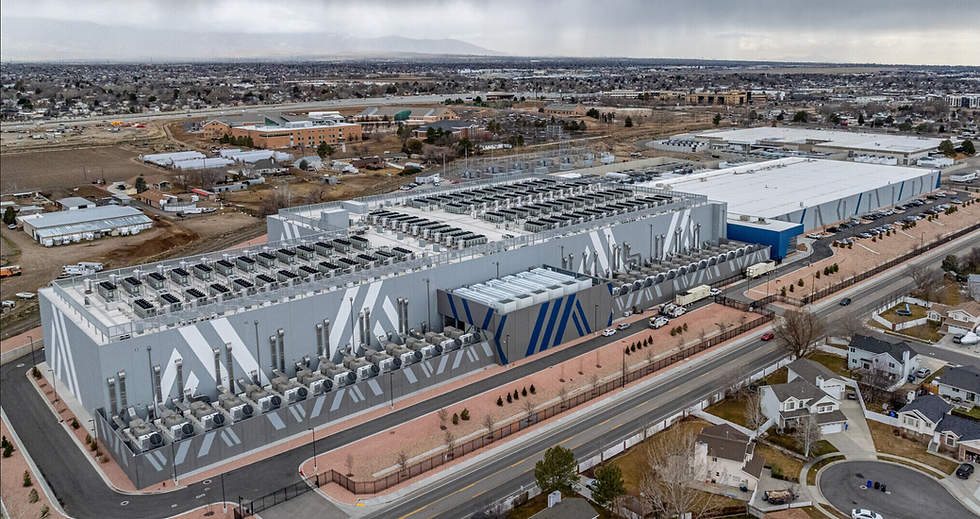
The numbers that describe most property types move slowly. Office vacancy drifts a point in a year. Apartment deliveries follow permits at a comfortable lag. Data centers stopped behaving this way around 2023, and the industry's measurement conventions have not caught up. Square footage, the unit commercial real estate has always counted in, now misses most of what matters, because the binding input of this asset class is no longer floor area. It is electrical capacity.
This census is our attempt to measure the asset class in its own units. MMCG assembled a property-level inventory of 1,784 unique U.S. data center facilities from the MMCG database, collapsed duplicates, standardized two reporting templates into one schema, and verified the largest entries against public filings, air permits, county records, and utility disclosures. The count as of June 2026: 1,259 existing buildings, 162 under construction, 328 proposed or in final planning, and a small tail of converted, deferred, and abandoned projects that tells its own quiet story. Where operators report power, we recorded it. Standing facilities carry 16.7 gigawatts of reported utility capacity. The pipeline carries 32.8 gigawatts. The ratio is 196 percent.
No property type in the modern record has carried a pipeline equal to roughly twice its standing stock. Industrial real estate at its 2022 peak ran near 6 percent of inventory under construction. Apartments peaked near 5 percent. Even by the data center sector's own square footage, the pipeline is about 90 percent of existing stock; measured in megawatts it is 196 percent, and the gap between those two ratios is itself a finding, because it means the buildings being proposed are a different machine than the buildings that exist. This report works through that arithmetic in nine sections: market performance, the supply census, demand, geography, the grid, development economics, capital markets, risk, and outlook. One caveat travels with every figure. Power capacity is reported for 630 of the 1,784 properties, so every megawatt total in this census is a floor, not a ceiling. The question the census ultimately serves is the one a credit committee asks: how much of this gets built, on whose power, at what cost, and against what evidence of demand.
1 | Market Performance: A Market That Is Effectively Pre-Sold
Start with the tightest number in American commercial real estate. Vacancy across the primary data center markets ended 2025 at 1.4 percent, a record low, and it got there while inventory grew 36 percent in a single year (1). Other trackers bracket the same condition from different definitions: 1.0 percent across North American colocation for a second consecutive year (2), 3.5 percent on a wider U.S. property universe (3), 1.4 percent in the quarterly series that most closely matches the primary markets (4). The spread among these figures is methodology, not disagreement. Every major tracker shows the same thing, which is a market operating at the practical limit of full.
Absorption explains why. Net absorption across primary markets reached 2,497.6 megawatts in 2025, up 38 percent on the prior record, with Northern Virginia alone taking 1,102 megawatts (1). And the capacity now under construction is not waiting to find tenants: roughly three-quarters of it was preleased at mid-2025, against a historical norm in the 40 to 50 percent range, and by year-end one tracker put the precommitted share, counting binding leases and owner-occupied projects together, at 92 percent (1)(2). A development pipeline that is rented before it is roofed is not speculative supply in any conventional sense. It is a backlog.
Pricing confirms the imbalance and adds a structural twist. The national average asking rate for a 250 to 500 kilowatt requirement rose 6.5 percent in 2025 to $195.94 per kilowatt per month, the fourth straight annual increase, and large contiguous blocks rose faster: 12.5 percent for 3 to 10 megawatt requirements, up to 19 percent for blocks above 10 megawatts in the tightest markets (1). For two decades, big deployments earned volume discounts. That discount has inverted. Scarcity now prices the large block at a premium to the small one, which is the clearest single signal that demand at the hyperscale end of the market has outrun supply.
The honest reading of these performance metrics is that vacancy has stopped being an informative statistic. When new supply arrives pre-sold and standing space rounds to zero, the market's real condition lives in the pipeline, in who is building it, and in whether it can be energized. That is where this census goes next.
2 | The Supply Census: 49.5 Gigawatts on the Books
The census counts 1,784 unique data center properties in the United States, built from 2,743 raw records after duplicate collapse and field reconciliation in the MMCG database. By square footage the asset class totals 443.5 million square feet, of which 225.3 million is standing and 203.6 million sits in the construction and planning pipeline. By status: 1,259 existing facilities, 162 under construction, 321 proposed, 7 in final planning, and 35 properties in the statuses nobody markets, including 21 abandoned and 6 demolished. We kept those in the file deliberately. An asset class's failures are part of its census.
Measured in power, the picture sharpens. The 630 properties reporting utility capacity account for 16.7 gigawatts of existing supply and 32.8 gigawatts of pipeline, with 9.0 gigawatts of critical IT capacity reported against the total. The pipeline-to-stock ratio of 196 percent on a megawatt basis, against 90 percent on a square footage basis, carries the report's first substantive conclusion: the proposed generation of facilities is not more of the same product. It is a denser, larger, more power-intensive machine, and Section 6 quantifies exactly how much.
Two disciplines govern how the rest of this report uses these numbers. First, they are floors. Capacity reporting is voluntary and incomplete, so 16.7 and 32.8 gigawatts understate the true totals by an unknowable margin, and we say so wherever the figures appear. Second, a property census captures one specific layer of reality: facilities that exist as identified buildings or formally proposed projects. Utilities disclose a second layer, contracted load that has signed agreements but no building yet, and the interconnection queues hold a third, speculative layer several times larger than either. Section 5 separates those layers explicitly, because confusing them is the single most common analytical error in current data center commentary, and the most expensive one for a lender to inherit.
3 | Demand: The Hyperscale Takeover
The existing stock was built for a mixed economy. By reported megawatts, standing facilities split 45 percent colocation, 33 percent hyperscale, and 22 percent enterprise, a profile assembled over twenty years of corporate IT, cloud migration, and carrier hotels. The pipeline has no such balance. Of pipeline megawatts with a reported facility type, 81.6 percent are hyperscale, 17.8 percent colocation, and one half of one percent enterprise. The enterprise data center, as a category of new construction, has effectively ceased to exist. Whatever gets financed and built from here is, overwhelmingly, infrastructure for a handful of technology companies and the AI laboratories they serve.
The demand side of that takeover is visible in public filings. The four largest cloud operators spent roughly $400 billion of combined capital expenditure in 2025 and guided 2026 toward $600 to $700 billion, with Microsoft signaling about $190 billion for calendar 2026, Amazon about $200 billion, Alphabet $180 to $190 billion, and Meta $125 to $145 billion (5). The chip vendor that supplies them booked $193.7 billion of data center revenue in its fiscal 2026, up 68 percent (6). Every one of these companies describes itself as capacity constrained rather than demand constrained. One nuance matters for real estate readers: roughly 60 percent of hyperscale capacity is owned rather than leased (7), so only a portion of this demand is addressable by third-party developers, a distinction that flatters neither the bulls nor the bears but changes who carries the construction risk.
Translate the pipeline into energy and the scale becomes legible to anyone. At 50 to 80 percent utilization, 32.8 gigawatts of utility capacity implies roughly 144 to 230 terawatt-hours of annual consumption, equivalent to 14 to 22 million American homes at the federal benchmark of 10,500 kilowatt-hours per household (8)(9). The band is deliberately anchored at both ends: the 50 percent floor is the published utilization assumption of the national laboratory that produces the government's data center energy estimates (8), and the 80 percent ceiling matches what the two most exposed utilities report and plan for, an 82 percent load factor at Dominion and an 80 percent planning standard at Duke (10). For context, all U.S. data centers consumed 176 terawatt-hours in 2023, about 4.4 percent of national electricity, and the same laboratory projects 325 to 580 terawatt-hours by 2028 (8). Our pipeline-implied figure sits comfortably inside that envelope, below the 2030 consensus rather than above it, which is worth stating plainly: the census does not require heroic demand assumptions to be true. The grid operators have already capitalized the implication, with the national reliability assessor lifting its ten-year peak demand forecast by 224 gigawatts, most of it attributed to data centers (11), and the utilities' research institute projecting the sector at 9 to 17 percent of U.S. generation by 2030 (12). Management consultants put the global capital requirement near $6.7 trillion by 2030 (13). One can quarrel with any single projection. It is harder to quarrel with all of them at once.
4 | Geography: Power Redraws the Map
The most repeated sentence in data center commentary, that Northern Virginia is the market, is now a description of the past tense. Virginia still holds the deepest standing cluster, and its 190 census properties confirm it. But Texas leads the property count outright at 240 facilities, and on reported megawatts the gap is not close: Texas carries 12.8 gigawatts across existing and pipeline against Virginia's 2.2, with North Carolina at 4.2 gigawatts, Arizona at 2.5, and Georgia at 2.1 forming a second tier that barely existed five years ago. Site selection has decoupled from fiber corridors and re-anchored on transmission capacity, land, and the willingness of a grid to say yes. The new map is drawn in substations.
Drop to the county level and the rotation becomes vivid, because the pipeline is concentrating in places few institutional investors could place on a map. We verified every large county figure in the census against permits, announcements, and regulatory filings before publishing it, and the verified set reads as follows. Pecos County, Texas leads the nation on the strength of a single 7.65 gigawatt gas generation air permit issued in January 2026, the largest such permit in U.S. history; the figure is a generation ceiling for a permitted, pre-construction campus, not energized IT load, and we label it that way (15). St Joseph County, Indiana carries 2.2 gigawatts at a hyperscale campus that went fully operational in October 2025 after an $11 billion build (14). Cumberland County, Pennsylvania holds a 1.35 gigawatt campus that began site work in April 2026 (16). Maricopa County, Arizona and Dallas County, Texas each carry roughly 1.3 gigawatts across multiple operators, the only two entries on the list that are genuinely diversified. Clay County, Missouri carries about 1.2 gigawatts of under-construction hyperscale capacity. Wyandotte County, Kansas shows roughly 1.0 gigawatt of documented proposals, every megawatt of it early-stage and the largest project in active litigation (17). Mecklenburg County, North Carolina rounds out the list near 0.7 gigawatts of approved capacity, now operating under a municipal moratorium that spares existing approvals but pauses new ones.
Notice the pattern inside that list. In four of the eight counties, a single campus accounts for essentially the entire county figure. County-level concentration risk in this asset class is therefore project-level risk wearing a geographic costume, and a lender exposed to one of these markets is exposed to one developer's power agreement, one zoning fight, one balance sheet. The two diversified counties, Maricopa and Dallas, are the exception that proves how unusual genuine market depth still is outside the legacy hubs.
What about incentives, the variable economic developers talk about most? The census suggests they explain less than advertised. Thirty-eight states now offer dedicated data center tax exemptions, which makes the incentive nearly universal and therefore nearly useless as a differentiator (18). Georgia's own state audit found that only 30 percent of its data center construction was attributable to the exemption; the rest would have come anyway (19). Virginia's program, the country's largest at roughly $1.6 billion in annual foregone revenue (20), has not prevented the state's relative share of the pipeline from eroding as its grid saturates. Meanwhile 84 percent of industry decision-makers rank power availability among their top three site criteria (21). Our reading is blunt: incentives are hygiene, power is strategy, and the 2026 legislative season, in which several states paused or moved to repeal their programs, means incentive-dependent pro formas now carry political risk on top of everything else.
5 | The Grid: A Utility-by-Utility Account of the Ramp
Nobody, to our knowledge, has published a facility-level account of which electric utilities carry the data center buildout. The census makes one possible, and the results reorder the conventional wisdom. The story is not the size of any utility's data center load. It is the ramp: the multiple between what a grid serves today and what its territory's pipeline asks of it tomorrow.
Three examples set the scale. In Duke Energy Carolinas territory, the census attaches 272 megawatts of existing data center capacity and 3,412 megawatts of pipeline, a twelvefold ramp. In PPL Electric's Pennsylvania territory, 7 megawatts existing stand against roughly 1,300 in pipeline. Ameren Missouri shows 53 against 705. Smaller in absolute terms, Salt River Project in Arizona carries 788 existing and 1,104 pipeline, and PacifiCorp roughly 101 against 650. These are property-derived figures, which means they capture the near-built layer, and the remarkable thing is what happens when you check them against the utilities' own disclosures: they hold up as conservative. Duke contracted 2.7 gigawatts of new data center load in the first quarter of 2026 alone and discloses a 7.8 gigawatt high-confidence late-stage pipeline (22). PPL discloses signed agreements that would carry its data center load from 800 megawatts in 2026 toward 14.4 gigawatts by 2034 (23). Georgia Power reports 11 gigawatts under contract even after removing 33 projects and more than 11,000 megawatts of earlier applicants from its pipeline (24). The census layer and the contracted layer point the same direction; the census simply arrives there first and lower.
The third layer is the one to distrust. Interconnection queues have become option pools, not order books. ERCOT's large-load queue passed 233 gigawatts in December 2025 while roughly 7.5 gigawatts had actually connected (25). PJM's last capacity auction cleared at its price cap for a third consecutive time, with the independent market monitor attributing 45 percent of three auctions' costs, $21.3 billion, to data center load forecasts; the grid operator then cut its own 2028 peak forecast by more than 4,400 megawatts after, in its words, improving the vetting of large-load requests (26). A former hyperscale energy executive estimates five to ten times more interconnection requests than data centers actually being built (27), and the leading independent load-growth analysts caution that utility forecasts may overstate data center demand by as much as 40 percent (10). The rule we propose for anyone underwriting against this sector is simple and we will repeat it in the risk section: energized load is fact, signed agreements are probability, and queue positions are options that mostly expire.
6 | Development Economics: Density, Cost, and the Comp Trap
Here is the finding that explains why the megawatt ratio and the square footage ratio diverge. The median reported power density of facilities built before 2000 in the census is 0.073 kilowatts per square foot. For standing facilities built since 2023 it is 0.172, and the pipeline cohort’s median is 0.225. Density has roughly tripled in a generation, while the average project has grown from 179,000 square feet among existing facilities to 416,000 in the pipeline. The buildings being proposed hold three times the power in two and a half times the area, with liquid cooling, Tier III concurrent maintainability, and N+1 redundancy as the default specification among reporting facilities, and a median design efficiency of 1.35. This is not the same product the existing stock represents, which has a direct and underappreciated consequence for valuation.
Now place two numbers side by side. Across 180 census transactions with reported capacity, the median sale of an existing U.S. data center cleared at about $2.67 million per megawatt, and across 373 transactions the median price was $185 per square foot. Against that, the global average cost merely to construct a data center shell reached $10.7 million per megawatt in 2025 and is forecast at $11.3 million for 2026 (28), with U.S. shell costs running $9.5 to $13.3 per watt depending on the market and an AI-specification premium of 7 to 10 percent (29). Add tenant fit-out for AI workloads, which can reach $25 million per megawatt, and a fully loaded AI facility approaches $30 to $40 million per megawatt (28). The gap between what standing assets trade for and what new capacity costs to create is therefore four to five times at the shell level and an order of magnitude all-in.
That gap is not a market inefficiency waiting to be arbitraged. It is two different goods sharing one name. The transaction median is dominated by older, smaller, low-density, enterprise-era facilities, many sold without long hyperscale leases; it approximates the salvage and repurposing value of the legacy stock. The construction figures price a new machine with secured power and contracted revenue. The amateur error, and we see it in credit memos with some regularity, is using standing-asset comparables to sanity-check a construction budget, which understates true cost four or five times over, or inverting the mistake and assuming legacy assets will reprice toward replacement cost, which they will not, because nobody is replacing them. The underwriting rule that falls out of the census is plain. Cost benchmarks govern new construction; transaction comparables govern legacy assets; and any analysis that crosses the two without saying so should be sent back.
7 | Capital Markets: Small Sales, Giant Structures
The capital markets evidence splits into two stories that look contradictory and are not. Conventional single-asset data center sales nearly halved in 2025, to roughly $3 billion across North America (1), because almost nobody sells a stabilized data center into a market this tight. At the same time, entity-level and structured transactions set records that would have been unthinkable three years ago: a roughly $40 billion agreement for a national development platform, the largest data center transaction ever recorded (30), and a single-campus joint venture financed with about $27 billion of investment-grade rated debt placed largely with two asset managers (31). The asset class did not stop trading. It changed instruments, moving from buildings to platforms and from mortgages to structured credit.
The debt market tells the same story at scale. Data center securitization issuance reached about $23.8 billion by mid-November 2025, more than double the full prior year, with average deal size near $1.1 billion (32). Investment-grade bond issuance by the hyperscalers themselves ran to roughly $121 billion. And the forward arithmetic is sobering: one major bank estimates a $1.5 trillion financing requirement for the sector through 2028, of which roughly $800 billion is expected from private credit (33). The rating agencies have responded with dedicated methodologies that tier facilities by tenant quality and remarketing risk (34), and the market has invented an instrument the last cycle never needed, the hyperscaler backstop, in which an investment-grade technology company guarantees the lease obligations of a thinly capitalized AI cloud tenant so the paper can price. The existence of that structure is itself a disclosure about where the credit risk in this sector actually sits.
Why does capital keep coming despite costs that run to $40 million a megawatt? Because the development spread remains extraordinary. Stabilized data centers trade at capitalization rates of roughly 5 to 6.5 percent, in line with premium industrial, while the largest listed developer reports expected stabilized yields near 11.9 percent on its development pipeline (35). A spread of 500 to 700 basis points between creation yield and exit yield is the engine of the entire buildout, and it is also the number to watch: the cycle's eventual turn will announce itself there, in compressing development spreads, before it ever shows up in vacancy.
8 | Risk: How Much of 196 Percent Is Real
A pipeline twice the standing stock invites one question above all others, and the honest answer begins with how much of it has not started. A major bank's analysis found that more than 60 percent of the capacity scheduled to come online within a year had not broken ground (36). A former hyperscale energy strategist expects only about one project in ten now being planned to reach completion (37). Georgia Power's regulator-reviewed pipeline shed 33 projects totaling more than 11,000 megawatts, about 65 percent of all the load that had ever applied (24). Our own view, for what a census-keeper's view is worth, is that the 10 percent figure is too pessimistic because it counts deliberate site-banking duplicates as failures, but the direction is right. We would underwrite to a base case in which one quarter to one third of pipeline megawatts convert to operating stock on or near schedule through 2028, with another tranche arriving years late and a meaningful share never arriving at all. Treat reported pipeline as an option pool, not a forecast.
The constraints that do the filtering rank in a particular order, and demand is not at the top of it. Equipment is. Power transformers quote 128-week lead times and generator step-up units 144 weeks (38), and the dominant turbine manufacturer's gas turbine backlog reached 100 gigawatts in the first quarter of 2026, with reservations expected sold out through 2030 (39). A project without secured long-lead equipment is a press release. Interconnection ranks second: total time from application to energization in the largest eastern market now exceeds seven years. Local politics ranks third and is the fastest-rising: at least 25 projects representing 4.7 gigawatts were cancelled in 2025 amid organized opposition, four times the prior year's count, with 188 opposition groups active across 40 states and roughly 40 percent of seriously contested projects ultimately dying (37). Rate politics now amplifies all of it, with peer-reviewed work projecting data center growth could raise average residential electricity bills 8 percent nationally and more than 25 percent in central Virginia by 2030 (41), and federal regulators ordering new co-location rules after finding the existing tariff unjust (42). The census carries one more quiet risk marker of its own: 16.7 percent of reporting properties sit inside a designated Special Flood Hazard Area, a fact that costs nothing to check and routinely goes unchecked.
Then there is the bear case on demand itself, which deserves a straight summary rather than a dismissal. One major consultancy calculates the AI industry will need about $2 trillion of annual revenue by 2030 to fund its computing buildout and projects an $800 billion shortfall (40). Prominent investors argue the hyperscalers understate depreciation on short-lived chips. The 2001 fiber overbuild sits in everyone's memory. Our position is the one the evidence supports: today's construction is backed by contracted demand, record preleasing, and tenants with fortress balance sheets, so the near-term pipeline is demand-justified; the open question is returns on capital, not occupancy of buildings, and the assets most exposed if AI monetization disappoints are single-tenant facilities leased to thinly capitalized AI clouds without backstops. A lender can hold both thoughts at once. The industry's optimists and pessimists are arguing about 2030. The credit decisions are being made about 2027.
9 | Outlook: The Gas-Fired Bridge and the New Feasibility Test
Who powers the pipeline is no longer an open question for the 2026 to 2029 window, whatever the press releases imply. Roughly 90 gigawatts of behind-the-meter generation for data centers has been announced nationally; about 2 gigawatts of it was operating by mid-2026 (43). Nuclear is real but late and mostly reallocative: the three restart projects tied to data center demand total about 2.3 gigawatts arriving between 2026 and 2029, and the marquee power purchase agreements at existing plants, 1,920 megawatts at one Pennsylvania station, 1,121 at an Illinois one, largely redirect electrons that already flow (44). Small modular reactors are a 2030s story on every credible timeline. That leaves natural gas, on-site and utility-built, plus the existing grid, to carry essentially the entire near-term buildout, with fuel cells as a bridge at the margin. The environmental arithmetic of that fact will become its own political constraint; the financing arithmetic is simpler, which is that a turbine delivery slot is now as valuable as a zoning approval.
Pull the nine sections together and the outlook resolves into a sentence: the constraint on this asset class has migrated from demand to deliverability, and underwriting practice has to migrate with it. The census suggests the standing stock grows on the order of 50 to 80 percent by 2029 rather than doubling, with the difference between those outcomes decided by transformers, interconnection dates, and county commissions rather than by tenants. For a lender or investor evaluating any single project inside that aggregate, the questions that decide the credit are now answerable, and they are these. Does the project hold an executed interconnection agreement or a permitted generation path with dates, not intentions? Are the long-lead electrical components ordered, with delivery slots a person can name? Is the revenue contracted to an investment-grade counterparty, or to a tenant whose obligations someone investment-grade has guaranteed? Does the jurisdiction's posture, on zoning, on water, on rates, on incentives, survive a two-year construction period? And is the cost basis benchmarked to creation cost rather than to comparables from a different machine?
Those five questions are, not coincidentally, the skeleton of a feasibility study. In a market where the pipeline is twice the stock and most of it will be filtered out by physics and politics, the third-party feasibility analysis that lenders rely on stops being a formality and becomes the instrument that separates the quarter that gets built from the announcements that do not. MMCG prepares bank-ready, independent feasibility studies for data center and adjacent projects nationwide, grounded in the property-level census this report is built on. If your institution is underwriting into this pipeline, we would welcome the conversation.
June 12, 2026, by Michal Mohelsky, J.D. Principal of MMCG Invest, LLC, feasibility study company. Interested in discussing market conditions for your data center project? Book a meeting with MMCG.
Reach out to discuss how our methodology supports your lending or development decision.

Michal Mohelsky, J.D. | Principal | mmcginvest.com
Contact: michal@mmcginvest.com
Phone: (628) 225-1125
About MMCG
MMCG Invest, LLC is a national commercial real estate feasibility consulting firm specializing in SBA and USDA feasibility studies across asset classes including hotels and hospitality, multifamily, RV parks, gas stations, and assisted living. Our analyses serve lenders, CDCs, investors, and developers seeking institutional-quality market intelligence for underwriting and investment decisions. Practicing Affiliate of the Appraisal Institute. Studies prepared under USPAP discipline.
Disclaimer: This report is provided for informational purposes only and does not constitute investment advice. Data presented herein is derived from proprietary MMCG databases and third-party sources believed to be reliable; however, MMCG Invest makes no representation as to the accuracy or completeness of such information. Figures from third-party industry databases have been independently verified and, where appropriate, adjusted to reflect MMCG's proprietary analytical methodology. Past performance is not indicative of future results.
A Note on Method
The census was compiled in June 2026 from the MMCG database of U.S. data center properties, consolidating 2,743 records across two export schemas into 1,784 unique properties on an address, city, and state key, with conflicting fields coalesced toward the most complete record. Utility capacity, critical IT capacity, density, vintage, transaction, and flood fields were retained where reported; capacity is reported for 630 properties and all megawatt figures are therefore floors. Every county figure above 700 megawatts and every named utility figure was independently verified against permits, regulatory dockets, operator announcements, and utility disclosures before publication; that verification pass corrected two county attribution errors in the source data, which we note in the interest of the standard we would hold anyone else to. Pipeline is defined throughout as under construction plus proposed plus final planning. Figures are point-in-time and will be refreshed in subsequent editions.
Sources
(1) CBRE, North America Data Center Trends H2 2025, and accompanying press materials, February 2026. cbre.com
(2) JLL, North America Data Center Report, Year-End 2025, February 17, 2026. jll.com
(3) Cushman & Wakefield, Americas Data Center Update H2 2025, February 26, 2026. cushmanwakefield.com
(4) datacenterHawk, 4Q 2025 Data Center Market Recap, January 2026. datacenterhawk.com
(5) Microsoft, Amazon, Alphabet, and Meta earnings disclosures and guidance, Q4 2025 through Q1 2026 reporting cycle (SEC filings and earnings calls), October 2025 to April 2026.
(6) NVIDIA Corporation, Form 8-K, fiscal Q4 2026 results, February 2026. sec.gov
(7) Synergy Research Group, hyperscale data center capacity analyses, 2025 to 2026. srgresearch.com
(8) Lawrence Berkeley National Laboratory, 2024 United States Data Center Energy Usage Report (LBNL-2001637), December 2024. eta-publications.lbl.gov
(9) U.S. Energy Information Administration, Electricity Use in Homes (Energy Explained) and national consumption series. eia.gov
(10) Grid Strategies, National Load Growth Report 2025, November 2025. gridstrategiesllc.com
(11) NERC, 2025 Long-Term Reliability Assessment, January 29, 2026. nerc.com
(12) EPRI, Powering Intelligence, updated edition, February 2026. epri.com
(13) McKinsey & Company, The Cost of Compute: A $7 Trillion Race to Scale Data Centers, October 2025. mckinsey.com
(14) CNBC, Amazon opens $11 billion AI data center in rural Indiana, October 29, 2025; Indiana Economic Development Corporation materials.
(15) Pacifico Energy, GW Ranch 7.65 GW TCEQ permit announcement, Business Wire, January 26, 2026; The Texas Tribune, February 2, 2026.
(16) PowerHouse Data Centers and Pennsylvania Data Center Partners, Pennsylvania Digital I announcement, July 15, 2025, and subsequent construction reporting, April 2026.
(17) KCUR, Wyandotte County data center power coverage, January 29, 2026; Kansas Reflector, Red Wolf litigation coverage, November 7, 2025; PowerTransitions, Quindaro announcement, July 17, 2025.
(18) National Conference of State Legislatures, Subsidizing Servers: How States Are Competing to Attract Data Centers, updated April 1, 2026. ncsl.org
(19) Georgia Department of Audits and Accounts with the Carl Vinson Institute of Government, Georgia Data Center Sales and Use Tax Exemption evaluation, December 2025. audits2.ga.gov
(20) Virginia Joint Legislative Audit and Review Commission, economic development incentives reporting, December 2024, and Biennial DCRSUT reporting, January 2026. jlarc.virginia.gov
(21) Bloom Energy, Data Center Power Report, 2025 edition. bloomenergy.com
(22) Utility Dive, Duke Energy added 2.7 GW of contracted data centers in Q1, May 2026; Duke Energy Q1 2026 earnings materials.
(23) Utility Dive and PPL Corporation Q1 2026 earnings disclosures, including the PPL Electric data center pipeline and Pennsylvania PUC rate case settlement, March to May 2026.
(24) Georgia Public Service Commission Dockets 56002, 56298, and 56310; Georgia Power large-load disclosures and staff testimony, 2025 to 2026; Utility Dive coverage.
(25) ERCOT board and large-load interconnection updates, December 9, 2025; Texas Senate Bill 6 (2025) and PUCT draft rule 16 TAC 25.194, March 2026.
(26) PJM Interconnection, 2027/28 Base Residual Auction results, December 17, 2025; Monitoring Analytics, capacity market reporting, January 2026; PJM 2026 Long-Term Load Forecast, January 14, 2026.
(27) Utility Dive, A fraction of proposed data centers will get built (Astrid Atkinson, Camus Energy), May 15, 2025.
(28) JLL, 2026 Global Data Center Outlook, January 6, 2026. jll.com
(29) Turner & Townsend, Data Centre Construction Cost Index 2025-2026, November 2025. turnerandtownsend.com
(30) Macquarie Asset Management and Aligned Data Centers, transaction announcement, October 15, 2025.
(31) Meta Platforms and Blue Owl Capital, Hyperion joint venture and related financing disclosures, October 2025.
(32) CRE Finance Council, Data Center E-Primer, February 2026, and CREFC World securitization reporting, December 2025.
(33) Morgan Stanley Research, data center financing analyses, July to August 2025.
(34) Moody's Ratings, Rating Methodology: Data Center Securitizations, February 6, 2025; related KBRA and Morningstar DBRS methodologies and presales, 2025.
(35) Digital Realty Trust, Q4 2025 earnings materials and development pipeline disclosures, February 2026.
(36) The Wall Street Journal, reporting on JPMorgan analysis of unstarted data center capacity, 2026.
(37) Heatmap News and Heatmap Pro, data center cancellation and opposition tracking, December 2025 to Q1 2026; statements of Peter Freed, Near Horizon Group.
(38) Wood Mackenzie, transformer and grid equipment lead-time analysis, Q2 2025.
(39) GE Vernova, Q1 2026 results (Form 8-K), April 22, 2026.
(40) Bain & Company, Global Technology Report, September 23, 2025.
(41) Carnegie Mellon University and North Carolina State University, Environmental Research Letters, electricity bill impact study, July 16, 2025.
(42) Federal Energy Regulatory Commission, Order in Docket EL25-49 (PJM co-located load), December 18, 2025.
(43) Cleanview, Bypassing the Grid: How Data Center Developers Are Building Their Own Power Plants, 2026. cleanview.co
(44) Constellation Energy and Microsoft, Crane Clean Energy Center announcements, September 2024 onward; Constellation and Meta, Clinton announcement, June 3, 2025; Talen Energy, Form 8-K, June 11, 2025.


Comments