Summary
Hazard exposure is now a first-order underwriting variable rather than an externality that sits outside the pro forma. Since 1980, NOAA has documented 403 billion-dollar weather disasters totaling $2.915 trillion in cumulative damage, and the five-year average from 2020 to 2024 stands at 23 billion-dollar events per year costing $149.3 billion annually.
The cost lands in the income statement. A Moody's Analytics study of CMBS-backed properties found insurance as a share of gross revenue doubled from 6.7% in 2018 to 13.4% in 2023 at the 99th percentile of cost burden, which without offsetting rent growth implies approximately a 12% decline in NOI and value and a 0.25x decrease in debt service coverage ratio. Mitigation prices well against that: an Alabama Department of Insurance study found FORTIFIED Roof homes had a 73% reduction in claim frequency, while FORTIFIED standards add between 0.29% and 1.43% of total building cost on multifamily.
Written for Developers budgeting in high-hazard markets, Lenders and CDCs sizing insurance risk, Feasibility analysts stress-testing insurance cost. 17 minute read.
Key figures
- U.S. billion-dollar weather disasters and cumulative damage
- 403 disasters totaling $2.915 trillion
- NOAA National Centers for Environmental Informationsince 1980
- Insurance as a share of gross revenue, 99th percentile of cost burden
- 6.7% to 13.4%
- Moody's Analytics study of CMBS-backed properties2018 to 2023
- Multifamily insurance cost per unit, in real terms
- $39/month to $68/month, a 75% increase
- Federal Reserve Board, September 2025 analysis2019 to 2024
- Claim reduction on FORTIFIED Roof homes after Hurricane Sally
- 73% lower claim frequency and 15% lower claim severity
- Alabama Department of Insurance study of 32,510 policiesHurricane Sally, 2020
- Projected loss in U.S. real estate value from climate-related risks
- $1.4 trillion
- First Street Foundation, 12th National Risk Assessmentnext 30 years, assessment published February 2025
Updated: Apr 20
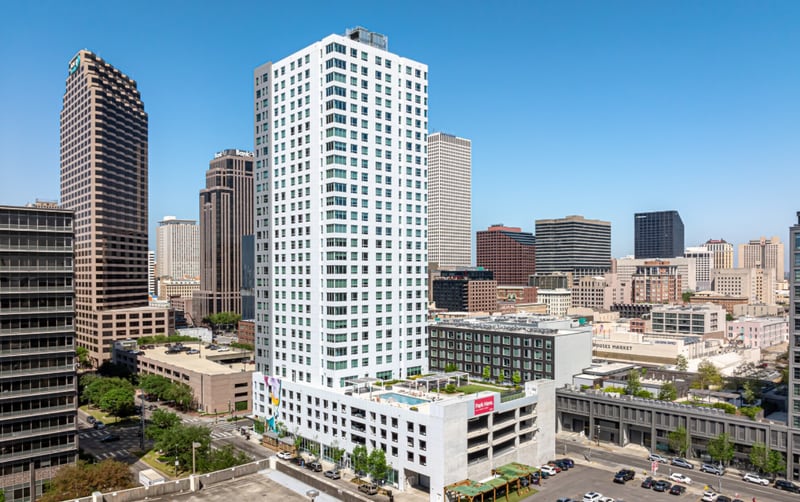
A contemporary mixed-use high-rise in downtown New Orleans illustrates the scale of post-Katrina reinvestment in the Gulf Coast's most wind-exposed metropolitan core. Structures of this profile, typically 20 stories or greater with integrated parking podiums, must satisfy stringent wind-load design criteria under ASCE 7-22, reflecting sustained hurricane exposure that FEMA classifies within a 150+ mph basic wind speed zone. Hurricane Katrina (2005) inflicted over $125 billion in total damages across the Gulf region and fundamentally reshaped building code enforcement, insurance underwriting standards, and lender risk modeling for commercial real estate in coastal Louisiana. For feasibility analysts, the convergence of tornado-alley proximity, Gulf hurricane corridors, and urban density in markets like New Orleans represents one of the most complex wind-hazard profiles in the continental United States.
The convergence of escalating natural catastrophe losses, an insurance market in structural upheaval, and climate-driven shifts in hazard geography is fundamentally altering the feasibility calculus for commercial real estate development in the United States. Since 1980, NOAA has documented 403 billion-dollar weather disasters totaling $2.915 trillion in cumulative damage, and the pace is accelerating.(1) The five-year average (2020 to 2024) now stands at 23 billion-dollar events per year costing $149.3 billion annually, compared to just 82 days between disasters in the 1980s versus 19 days today.(1) For commercial developers, lenders, and investors, these statistics are no longer abstract climate data. They are underwriting inputs that determine whether projects pencil, whether insurance can be obtained, and whether capital will flow.
The implications extend far beyond coastal hurricane markets. Severe convective storms, encompassing tornadoes, hail, and straight-line winds, generated nearly $200 billion in U.S. insured losses from 2020 to 2024, a 2.5x increase over the prior five-year period.(2)(3) Tornado Alley has shifted roughly 400 to 500 miles eastward into more densely populated southeastern markets.(4) Hail damage now exceeds $10 billion annually.(5) And the commercial property insurance market, which saw peak rate increases of 20.4% in Q1 2023, has created a two-tier system in which catastrophe-exposed properties face fundamentally different economics than those in benign geographies.(6)
The numbers
| Category | Number of Events | Total Cost ($B, CPI-Adjusted) |
|---|---|---|
| 2000 | 5 | 15.5 |
| 2001 | 3 | 21.8 |
| 2002 | 6 | 27.2 |
| 2003 | 7 | 38.4 |
| 2004 | 6 | 92.3 |
| 2005 | 6 | 268.6 |
| 2006 | 8 | 25.2 |
| 2007 | 5 | 18.9 |
| 2008 | 12 | 94.1 |
| 2009 | 9 | 19.8 |
| 2010 | 7 | 20.2 |
| 2011 | 18 | 98.1 |
| 2012 | 11 | 158.9 |
| 2013 | 10 | 32.3 |
| 2014 | 10 | 25.4 |
| 2015 | 11 | 31 |
| 2016 | 15 | 61.3 |
| 2017 | 19 | 395.9 |
| 2018 | 16 | 116.1 |
| 2019 | 14 | 55.5 |
| 2020 | 22 | 120.6 |
| 2021 | 20 | 164.5 |
| 2022 | 18 | 183.6 |
| 2023 | 28 | 95.3 |
| 2024 | 27 | 182.7 |
Hurricane Exposure Threatens $11.7 Trillion in Property Value
The Atlantic hurricane basin remains the single largest concentration of natural catastrophe risk for U.S. commercial real estate. NOAA's 1991 to 2020 baseline shows an average season produces 14 named storms, 7 hurricanes, and 3 major hurricanes (Category 3+), but recent years have far exceeded these norms.(7) The 2024 season produced 18 named storms and 11 hurricanes, including five U.S. landfalls, making it the deadliest mainland hurricane year since 2017, with 356 hurricane-related fatalities.(1)
The financial toll has been staggering. Hurricane Ian (2022) produced $113 billion in economic damage and $54 billion in insured losses as a Category 4 strike on southwest Florida. Hurricane Helene (2024) generated $78.7 billion in economic losses as a Category 4 landfall on Florida's Big Bend, but its most devastating impacts came from catastrophic flooding across western North Carolina, where fewer than 2% of affected homeowners carried flood insurance . Hurricane Milton (2024), which followed Helene by just two weeks, added another $34.3 billion in damages.(2)
- Insured Loss ($B)
- Uninsured Gap ($B)
The numbers behind this chart
| Category | Insured Loss ($B) | Uninsured Gap ($B) |
|---|---|---|
| Katrina (2005, Cat 3) | 107.5 | |
| Harvey (2017, Cat 4) | 39.7 | |
| Ian (2022, Cat 4) | 58.9 | |
| Maria (2017, Cat 4) | 38.8 | |
| Sandy (2012, Cat 1) | 42.1 | |
| Ida (2021, Cat 4) | 42.7 | |
| Helene (2024, Cat 4) | 17.5 | |
| Irma (2017, Cat 4) | 39.5 | |
| Andrew (1992, Cat 5) | 36.9 | |
| Ike (2008, Cat 2) | 27 |
CoreLogic (now Cotality) quantifies the structural exposure: 33.1 million residential properties face moderate or greater hurricane wind damage risk, representing $11.7 trillion in reconstruction cost value.(8) Storm surge risk alone threatens 6.6 million homes valued at $2.19 trillion. The metro-level concentrations are particularly concerning for commercial portfolios. Miami-Dade, Broward, and Palm Beach counties scored just 47, 45, and 35 out of 100 on wind resiliency indices.(8) Tampa Bay faces potential losses of $123 billion from a single Category 3 storm surge event affecting 500,000 homes, rising to $174 billion at Category 4. - To understand location specifics risk - see our interactive wind risk map here.
Climate projections indicate these risks will intensify. NOAA's Geophysical Fluid Dynamics Laboratory projects that while overall hurricane frequency may slightly decline, the proportion of storms reaching Category 4 to 5 intensity will roughly double by end of century under a 2°C warming scenario.(9) Near-storm rainfall rates are projected to increase 14% (range: 6 to 22%), and rapid intensification events, which tripled between 1980 and 2023, are expected to become more frequent.(9)(10) Without climate warming, Hurricane Milton would likely have made landfall as a Category 2 rather than Category 3.(10)
For development feasibility , the critical insight is geographic concentration risk. Florida's Big Bend region was struck by three hurricanes in 13 months (Idalia, Debby, and Helene). The New York metro area has 3.7 million properties at hurricane wind risk worth approximately $2 trillion in reconstruction value.(8) A single major landfall on any of these metro clusters could produce $50 to $100 billion or more in commercial and residential losses, with cascading effects on insurance availability, property valuations, and debt service capacity for years afterward.
Tornado Alley Has Moved, and So Has the Risk Map for Commercial Development
The United States averages approximately 1,200 tornadoes per year, but 2024 shattered norms with 1,796 confirmed tornadoes, the second-most active year on record.(5) More significant than raw counts is the geographic redistribution of tornado risk. Peer-reviewed research from Coleman, Thompson, and Forbes (2024), published in the Journal of Applied Meteorology and Climatology, documents a definitive shift: comparing 1951 to 1985 to 1986 to 2020, tornado frequency has declined across the traditional Great Plains corridor (northern Texas, southern Oklahoma) while increasing substantially in the mid-South and Southeast, what meteorologists call "Dixie Alley."(4)
The magnitude of this shift is approximately 400 to 500 miles eastward.(4) Jackson, Mississippi now sits in the region of largest tornado frequency increase; Cleburne, Texas has experienced the largest decrease. The 2025 tornado season confirmed this pattern: the top five states by tornado count were Texas (162), Illinois (147), Missouri (120), Mississippi (111), and Alabama (72), four of five east of traditional Tornado Alley.(5)
This geographic shift carries profound implications for commercial real estate underwriting. The Southeast presents compounding vulnerability factors that the Great Plains does not: higher population density, more tree cover generating debris missiles, more nighttime tornadoes (which are 2.5 times more likely to cause fatalities), and a larger inventory of manufactured housing.(4) Summer tornado frequency has declined 37% nationally, but cold-season tornado activity has increased, precisely when nighttime exposure is highest.
- 1991 to 2010 Avg
- 2011 to 2024 Avg (est.)
The numbers behind this chart
| Category | 1991 to 2010 Avg | 2011 to 2024 Avg (est.) |
|---|---|---|
| TX | 154 | 140 |
| KS | 96 | 80 |
| FL | 66 | 58 |
| OK | 62 | 55 |
| NE | 57 | 51 |
| IL | 54 | 64 |
| IA | 51 | 56 |
| MO | 45 | 52 |
| AL | 44 | 56 |
| MS | 43 | 55 |
| AR | 39 | 48 |
| LA | 37 | 39 |
| GA | 29 | 35 |
| TN | 26 | 35 |
| IN | 22 | 29 |
While individual tornado damage figures are significant, the broader severe convective storm (SCS) category tells the more consequential story for commercial real estate. SCS events encompassing tornadoes, hail, and straight-line winds produced insured losses of approximately $55 to $60 billion in 2023 (shattering the previous record by $20 billion), followed by $51 billion in both 2024 and 2025.(2)(3) CoreLogic estimates that 66 million homes ($21 trillion in reconstruction value) face tornado risk, while 53 million homes ($18.6 trillion) face straight-line wind risk.(8)
Hail and Straight-Line Winds Now Rival Hurricanes as Loss Drivers
Perhaps the most underappreciated risk to commercial real estate development is the explosive growth in hail and non-tornadic wind losses. Severe convective storm losses have exceeded $50 billion annually for three consecutive years (2023 to 2025), and Swiss Re data shows SCS losses growing at 7% annually over the past 30 years.(2) Hail alone is responsible for 50 to 80% of annual SCS insured losses, now exceeding $10 billion per year in destruction across North America.(3)
The geography of hail risk is concentrated but expanding. Texas leads with 1,366 hail events annually (2021 to 2024 average), followed by Nebraska, Colorado, Kansas, and South Dakota.(5) Texas hail events more than doubled between the 2018 to 2021 and 2021 to 2024 measurement periods.
Straight-line wind events, particularly derechos, represent another dimension of commercial property risk. NOAA's Storm Prediction Center reports over 15,000 damaging wind events annually, making them the most common severe storm hazard.(5) The August 2020 Midwest derecho, with winds reaching 140 mph along a 770-mile path, produced $11.5 billion in damage, the costliest thunderstorm in U.S. history.
For commercial developers, ASCE 7-22 wind speed design requirements define the engineering baseline. The standard now uses mean recurrence interval-based maps, with Risk Category II (standard commercial) structures designed to a 700-year return period.(11) Design wind speeds range from 90 to 100 mph in protected interior valleys to 170 to 200+ mph in Miami-Dade and Broward Counties' High Velocity Hurricane Zone. Notably, ASCE 7-22 introduced the first-ever dedicated tornado load chapter (Chapter 32), requiring specific design provisions for Risk Category III and IV structures in tornado-prone regions.(11)
The numbers behind this chart
| Category | Design Wind Speed (mph) |
|---|---|
| Miami (HVHZ) | 175 |
| Key West | 170 |
| Tampa | 150 |
| Mobile, AL | 146 |
| Corpus Christi, TX | 145 |
| New Orleans | 140 |
| Charleston, SC | 139 |
| Wilmington, NC | 139 |
| Houston | 136 |
| Jacksonville, FL | 130 |
| Virginia Beach | 125 |
| New York City | 115 |
| Boston | 115 |
| Atlanta | 115 |
| Nashville | 115 |
| Charlotte | 115 |
| Dallas | 115 |
| Oklahoma City | 115 |
| Kansas City | 115 |
| Omaha | 115 |
| St. Louis | 115 |
| Chicago | 115 |
| Minneapolis | 110 |
| Denver | 110 |
| Phoenix | 110 |
| Las Vegas | 100 |
| San Francisco | 100 |
| Los Angeles | 95 |
| Seattle | 95 |
| Portland, OR | 95 |
The Insurance Market Has Created a Two-Tier System for Commercial Property
The commercial property insurance market has undergone a structural transformation that directly impacts development feasibility. The Council of Insurance Agents and Brokers documented average commercial property rate increases of 20.4% in Q1 2023, the highest in over 20 years, following 25 consecutive quarters of increases.(6) While rates have since moderated (Marsh reported -4% in Q4 2024 and -8% by Q4 2025 as reinsurance capacity returned), the market has bifurcated sharply between catastrophe-exposed and non-catastrophe properties.(6)
The numbers behind this chart
| Category | Rate Change (%) |
|---|---|
| Q1 18 | 2 |
| Q2 18 | 3 |
| Q3 18 | 3 |
| Q4 18 | 4 |
| Q1 19 | 5 |
| Q2 19 | 6 |
| Q3 19 | 8 |
| Q4 19 | 10 |
| Q1 20 | 12 |
| Q2 20 | 15 |
| Q3 20 | 18 |
| Q4 20 | 17 |
| Q1 21 | 15 |
| Q2 21 | 12 |
| Q3 21 | 9 |
| Q4 21 | 8 |
| Q1 22 | 6 |
| Q2 22 | 6 |
| Q3 22 | 6 |
| Q4 22 | 7 |
| Q1 23 | 17 |
| Q2 23 | 19 |
| Q3 23 | 14 |
| Q4 23 | 11 |
| Q1 24 | 6 |
| Q2 24 | 3 |
| Q3 24 | -1 |
| Q4 24 | -4 |
| Q1 25 | -9 |
| Q2 25 | -9 |
| Q3 25 | -9 |
| Q4 25 | -8 |
Florida epitomizes the crisis. Seven Florida-based property insurers went bankrupt during 2021 to 2022, and at least 10 have left the state or become insolvent since 2020.(12) Citizens Property Insurance, the state's insurer of last resort, saw its policy count surge from 420,000 in 2019 to a peak of approximately 1.4 million. Average Florida homeowners premiums reached the highest in the nation, with estimates ranging from $8,770 to $14,140 depending on methodology, representing a 54% increase since 2019.(12)
Louisiana suffered similarly, with 12 insurers declaring insolvency between July 2021 and February 2023. Louisiana insurers paid out $4 for every $1 in premium collected in 2021.(12)
The Hail Belt states ( Texas , Oklahoma, Kansas, Nebraska, Colorado) now face insurance market conditions rivaling or exceeding Florida's.(13) Surplus lines markets handle approximately 40% of commercial property placements in core Hail Belt states, up from roughly 18% three years ago. Wind and hail deductibles have been pushed to 3 to 5% of total insured value, creating massive out-of-pocket exposure.(13) On a $10 million commercial property, a 3% wind/hail deductible represents $300,000 in self-insured retention per event, compared to a typical flat deductible of $1,000 to $5,000 for non-catastrophe perils.
The numbers behind this chart
| Category | Annual Premium ($) |
|---|---|
| Oklahoma | 5858 |
| Kansas | 4843 |
| Nebraska | 4800 |
| Florida | 4419 |
| Colorado | 4099 |
| Arkansas | 3958 |
| Texas | 3851 |
| Louisiana | 3594 |
| Missouri | 3543 |
| South Dakota | 3390 |
| Mississippi | 3380 |
| Montana | 3289 |
| Kentucky | 3326 |
| North Dakota | 3147 |
| Alabama | 3147 |
- Insolvencies
- Additional Exits/Restrictions
The numbers behind this chart
| Category | Insolvencies | Additional Exits/Restrictions |
|---|---|---|
| Florida | 15 | 15 |
| Louisiana | 12 | 8 |
| California | 0 | 9 |
| Texas | 0 | 4 |
Rising Insurance Costs Are Eroding NOI and Killing Deal Feasibility
For commercial real estate underwriting, insurance cost escalation has moved from a line-item nuisance to a deal-breaking variable. A Moody's Analytics study of CMBS-backed properties found that for properties at the 99th percentile of insurance cost burden, insurance as a share of gross revenue doubled from 6.7% in 2018 to 13.4% in 2023.(14) Without offsetting rent growth, such properties face approximately a 12% decline in NOI and value, a 9-percentage-point increase in implied loan-to-value ratio, and a 0.25x decrease in debt service coverage ratio.(14)
The Federal Reserve Board's September 2025 analysis confirmed that multifamily insurance costs per unit increased from $39/month in 2019 to $68/month in 2024 in real terms, a 75% increase, with landlords able to pass through only about one-third of the increase via rent.(15) JP Morgan projects commercial property insurance costs are on track to increase approximately 80% by 2030.
- Median (% of Revenue)
- 99th Percentile (% of Revenue)
The numbers behind this chart
| Category | Median (% of Revenue) | 99th Percentile (% of Revenue) |
|---|---|---|
| 2018 | 1 | 6.7 |
| 2019 | 1.2 | 7.5 |
| 2020 | 1.4 | 8.5 |
| 2021 | 1.6 | 9.8 |
| 2022 | 1.9 | 11.2 |
| 2023 | 2.3 | 13.4 |
| 2024 | 2.5 | 13.5 |
These dynamics directly affect lending standards across all commercial loan programs. SBA 7(a) and 504 loans require hazard insurance covering full replacement cost on all pledged collateral, with separate wind, hail, and flood policies required in applicable zones.(16) CMBS loans impose more comprehensive requirements, typically demanding DSCR of 1.20x to 1.40x and LTV of 65 to 75%. A simple illustration demonstrates the impact: on a $10 million property generating $750,000 in gross revenue, insurance increasing from 0.5% to 2.0% of property value adds $150,000 in annual expense, potentially reducing DSCR from 1.23x to 1.15x, below many lenders' minimum thresholds.
FEMA's mandatory flood insurance requirements compound the challenge. All federally backed loans for properties in Special Flood Hazard Areas require NFIP coverage. Risk Rating 2.0, fully implemented in April 2023, replaced zone-based pricing with property-specific actuarial rates, driving median premiums from $689 toward a full-risk target of $1,288, with 9% of policyholders facing eventual increases exceeding 300%.
Construction cost premiums for building to code in high-hazard zones add further pressure. Impact-resistant glazing costs $45 to $66 per square foot installed versus $25 to $35 for standard glass, a 40 to 100% premium. High Velocity Hurricane Zone construction in Miami-Dade adds 5 to 10% to total project costs when integrated from foundation up. ICF construction, capable of withstanding 200 mph winds, costs 15 to 20% more than wood frame.
- Properties at Risk (Millions)
- RCV at Risk ($Trillions)
The numbers behind this chart
| Category | Properties at Risk (Millions) | RCV at Risk ($Trillions) |
|---|---|---|
| Tornado (EF0+) | 76 | 27 |
| Straight-Line Wind (≥65 mph) | 64 | 23 |
| Hail (≥1 inch) | 43.5 | 17.84 |
| Hurricane Wind | 33.1 | 11.68 |
| Storm Surge | 6.6 | 2.19 |
Capital Is Beginning to Migrate Away from Catastrophe-Exposed Markets
Institutional investment patterns are starting to reflect hazard-adjusted return calculations. First Street Foundation's 12th National Risk Assessment (February 2025) projects that U.S. real estate values could lose $1.4 trillion over the next 30 years due to climate-related risks.(17) The assessment identified 21,750 "Climate Abandonment" neighborhoods and 9,063 "Economic Decline" neighborhoods nationally.(17) Separately, research published in Nature Climate Change found that residential properties exposed to flood risk are currently overvalued by $121 to $237 billion, concentrated in coastal counties without flood risk disclosure laws.(18)
Morgan Stanley Investment Management reports that leading REITs are applying internal shadow carbon prices to new acquisitions, conducting portfolio impairment testing, and in some cases passing altogether on new deals that would add material climate risk. Cotality data shows Florida residents migrating from high-risk coastal areas to inland cities, with 48% of mortgage applications from people leaving Florida targeting Georgia, North Carolina, South Carolina, Tennessee, and Texas, though several of these destination states face their own escalating hazard profiles.(8)
The insurance market itself is becoming a binding constraint on capital deployment. In California , 13% of Realtors reported at least one transaction fell through in 2024 because buyers could not secure insurance, nearly double the prior year's rate. An estimated 12% of homeowners nationally now carry no property insurance, up from 5% in 2019.
Fortified Construction Offers Measurable ROI, but Adoption Remains Limited
The IBHS FORTIFIED program represents the most rigorously studied mitigation standard for wind and hail hazards.(16) Operating at three tiers, FORTIFIED Roof, Silver, and Gold, the program provides progressively stronger protection from roof system hardening through building envelope reinforcement to continuous structural load path enhancement.
Performance data from Hurricane Sally (2020) provides compelling evidence. An Alabama Department of Insurance study of 32,510 policies found FORTIFIED Roof homes experienced a 73% reduction in claim frequency and 15% reduction in claim severity compared to conventional construction. FORTIFIED Gold homes achieved 76% fewer claims and 24% lower severity. If all homes in Sally's path had been built to FORTIFIED Gold, insurers would have saved an estimated $116.1 million.(16)
- Remaining Losses ($M)
- Savings from FORTIFIED ($M)
The numbers behind this chart
| Category | Remaining Losses ($M) | Savings from FORTIFIED ($M) |
|---|---|---|
| Actual Losses (Conventional) | 243.6 | 0 |
| If All FORTIFIED Roof (Savings: $140M) | 103.6 | 140 |
| If All FORTIFIED Gold (Savings: $152M) | 91.6 | 152 |
Cost premiums are surprisingly modest. University of Alabama research found FORTIFIED standards increase multifamily construction costs between 0.29% and 1.43% of total building cost, with ROI ranging from 8.1% (inland hail protection) to 72% (coastal Gold designation).(16) New residential construction to full FORTIFIED Gold adds approximately 3 to 5% to total cost. Insurance premium discounts of 20 to 55% on wind coverage are available across multiple states. Alabama leads with over 53,000 certified FORTIFIED homes, and the National Institute of Building Sciences calculates that building code enhancements deliver an 11:1 benefit-cost ratio in avoided disaster losses.
Despite these economics, adoption remains limited. Approximately 70,000 properties across 31 states have been built or re-roofed using FORTIFIED standards, a fraction of the 33 million at hurricane wind risk. For commercial developers, the calculus is straightforward but underutilized: a 1 to 3% construction cost premium that reduces insurance costs by 20 to 55% and increases property value by approximately 7% represents one of the most efficient risk-adjusted investments available in high-hazard markets.
Conclusion: Hazard Risk Is Now a First-Order Variable in Development Feasibility
The data assembled here points to several conclusions that commercial real estate feasibility analysts must internalize. First, natural hazard losses are not cyclical. They are trending structurally higher, driven by both climatic changes and the continued expansion of development into hazard-exposed geographies. Second, the insurance market has undergone a permanent structural shift in which catastrophe-exposed properties face fundamentally different economics, with percentage-based deductibles of 3 to 5% of insured value, surplus lines placement requirements, and insurance costs consuming 5 to 13% of gross revenue rather than the historical 2 to 3%.(14) Third, the geographic redistribution of tornado and hail risk means that markets previously considered "safe," the mid-South, Midwest, and Southeast, are entering a higher-risk profile precisely as development activity migrates toward them.(4)
For MMCG Invest's feasibility consulting practice , these dynamics necessitate explicit hazard-adjusted underwriting. Every pro forma should stress-test insurance costs at 150 to 200% of current levels over the hold period. DSCR analysis should incorporate percentage-based wind/hail deductibles as a contingent expense. Construction budgets in high-wind zones should reflect ASCE 7-22 requirements and evaluate FORTIFIED or equivalent resilient construction standards, which add 1 to 5% to construction costs but reduce insurance expense by 20 to 55% and increase asset value by approximately 7%.(16) And capital allocation decisions should weigh the $1.4 trillion in projected real estate value erosion identified by First Street Foundation against the current cap rate compression in hazard-exposed Sunbelt markets.(17)
The developers, lenders, and investors who build hazard awareness into their feasibility models today will capture risk-adjusted returns. Those who treat natural catastrophe exposure as an externality, as the market has historically done, face an increasingly expensive lesson in repricing.
About MMCG Invest, LLC
MMCG Invest, LLC is a national commercial real estate feasibility consulting firm specializing in third-party feasibility studies for SBA 7(a) , SBA 504, and USDA guaranteed loan programs across 30+ commercial real estate asset classes, including hotels , multifamily , industrial , glamping and short-term rental resorts , gas stations , retail , and assisted living facilities . Our studies incorporate location hazard analysis, insurance cost modeling, and construction code compliance evaluation to meet the analytical rigor required by leading government-guaranteed lenders, CDCs, and institutional investors. For more information, visit mmcginvest.com or contact our team directly.
Financing a project in a risk area? Contact our team to discuss how a bankable feasibility study supports your project.

Michal Mohelsky, J.D. | Principal | mmcginvest.com
Contact: michal@mmcginvest.com
Phone: (628) 225-1110
Disclaimer: This report is provided for informational purposes only and does not constitute investment advice. Data presented herein is derived from proprietary MMCG databases and third-party sources believed to be reliable; however, MMCG Invest makes no representation as to the accuracy or completeness of such information. Figures from third-party industry databases have been independently verified and, where appropriate, adjusted to reflect MMCG's proprietary analytical methodology. Past performance is not indicative of future results.
Sources
(1) NOAA National Centers for Environmental Information. "Billion-Dollar Weather and Climate Disasters." CPI-adjusted, updated January 2025. https://www.ncei.noaa.gov/access/billions/
(2) Swiss Re Institute. "sigma 1/2025: Natural Catastrophes -- Insured Losses on Trend." https://www.swissre.com/institute/research/sigma-research.html
(3) Munich Re NatCatSERVICE. "Severe Convective Storms: Trends and Mitigating Future Loss." https://www.munichre.com/en/insights/business-risks/severe-convective-storms-trends-and-mitigating-future-loss.html
(4) Gensini, V.A. & Brooks, H.E. (2018). "Spatial Trends in United States Tornado Frequency." npj Climate and Atmospheric Science. See also: Scientific American, "Tornado Alley Is Migrating Eastward." https://www.scientificamerican.com/article/watch-out-tornado-alley-is-migrating-eastward/
(5) Insurance Information Institute. "Facts + Statistics: Tornadoes and Thunderstorms." https://www.iii.org/fact-statistic/facts-statistics-tornadoes-and-thunderstorms
(6) Marsh McLennan. "Global Insurance Market Index -- U.S. Property Insurance Rates." https://www.marsh.com/en/services/international-placement-services/insights/us-insurance-rates.html
(7) Insurance Information Institute. "Facts + Statistics: Hurricanes." https://www.iii.org/fact-statistic/facts-statistics-hurricanes
(8) Cotality (formerly CoreLogic). "Hurricane Risk 2025: Outpriced and Underwater." https://www.cotality.com/insights/articles/hurricane-risk-2025
(9) NOAA Geophysical Fluid Dynamics Laboratory. "Global Warming and Hurricanes." Knutson et al., updated November 2024. https://www.gfdl.noaa.gov/global-warming-and-hurricanes/
(10) Climate Central. "Study: Ocean Warming Has Intensified Recent Hurricanes." https://www.climatecentral.org/climate-matters/hurricane-strength-attribution
(11) FEMA / ASCE. "Highlights of Significant Changes to the Wind Load Provisions of ASCE 7-22." https://www.fema.gov/sites/default/files/documents/fema_asce-7-22-wind-highlights_fact-sheet_2022.pdf
(12) Insurance Information Institute. "Triple-I: Louisiana's Insurance Crisis Grew After 2020-21 Hurricanes." See also: Florida Risk Partners.
(13) Captives Insure. "Property Market Softens Broadly -- But Coastal, CAT-Exposed, and Hail Belt Risks Still Stressed." https://captives.insure/insights/property-market-softens-broadly-but-coastal-cat-exposed-and-hail-belt-risks-still-stressed
(14) Moody's Analytics / ULI Urban Land Magazine. "Insurance Premiums Double in Many U.S. States." https://urbanland.uli.org/capital-markets-and-finance/insurance-premiums-double-in-many-u-s-states
(15) Federal Reserve Board. "Rising Property Insurance Costs and Pass-Through to Rents for Apartment Buildings." FEDS Notes, September 2025. https://www.federalreserve.gov/econres/notes/feds-notes/rising-property-insurance-costs-and-pass-through-to-rents-for-apartment-buildings-20250919.html
(16) Insurance Institute for Business & Home Safety (IBHS). "Study Shows FORTIFIED Program Reduced Hurricane Sally Damage." University of Alabama CRIR / Alabama DOI (May 2025). https://ibhs.org/ibhs-news-releases/study-shows-ibhss-fortified-program-reduced-hurricane-sally-damage/
(17) First Street Foundation. "12th National Risk Assessment." February 2025. https://firststreet.org/research-library/property-prices-in-peril
(18) Gourevitch, J.D. et al. (2023). "Unpriced Climate Risk and the Potential Consequences of Overvaluation in US Housing Markets." Nature Climate Change. https://www.nature.com/articles/s41558-023-01594-8
Valuation Fundamentals

Michal Mohelsky, J.D., FMVA, Practicing Affiliate of the Appraisal Institute
Principal, MMCG Invest, LLC
Published April 14, 2026. Last updated April 20, 2026. How this analysis was prepared.
Cite this
Michal Mohelsky, J.D., FMVA (2026). Natural Hazards Are Repricing Commercial Real Estate Across America. MMCG Invest, LLC. https://www.mmcginvest.com/post/natural-hazards-are-repricing-commercial-real-estate-across-america
Where this goes next
- Bankable Feasibility Study & Financial Feasibility StudyMMCG's feasibility study page for this subject.