Summary
Every self-storage SBA 7(a) written in 2026 is in substance a projection loan, and the feasibility study, not the appraisal, must show step by step how coverage is earned from a book that does not cover at closing. The composite subject, an 82,000 net rentable square foot, 560-unit facility bought for $4,050,000 inside a $5,840,000 project financed with a $5,000,000 7(a) at 9.25 percent, shows trailing NOI of $494,000 on the sellers' books, covering debt service at 0.96x; normalized to market management, reassessed taxes, real insurance and a capital reserve, trailing NOI is $348,000 and coverage is 0.68x.
The revenue engine is the in-place book, not the street rate: Public Storage's Q4 2025 move-in rent was $11.60 per square foot against realized rent of $22.53, while the subject's in-place rent of $9.60 sits 13 percent below its local street rate of roughly $11.00. An ECRI program lifting the book toward $12.20 over thirty months, a protection plan taking ancillary from 3 percent of revenue toward 7.5 percent, and a 12,000 square foot climate-controlled expansion take stabilized Year 4 revenue to $1,100,000, NOI to $649,000 and coverage to 1.26x. Under the combined stress case NOI falls to roughly $563,000 and coverage to 1.10x, which the credit survives only because of its 8.6 percent going-in cap and $49 per foot basis.
Written for SBA 7(a) and 504 lenders underwriting self-storage acquisitions, CDCs and credit committees reviewing projection loans, self-storage buyers planning an expansion or reposition. 37 minute read.
Key figures
- US households renting self-storage
- 12.6 percent
- Self Storage Association, Self Storage Demand Study, 2025 edition (C+R Research, 2024 data)2024
- Existing home sales
- 4.06 million
- National Association of Realtors, existing-home sales, annual totals2025
- National blended advertised rate
- $16.07 per square foot annualized
- Yardi Matrix national self-storage reportsMarch 2026
- Public Storage average annual contract rent per square foot for tenants moving in
- $11.60
- Public Storage, Q4 2025 earnings release and 8-K operating updatesfourth quarter of 2025
- Forecast self-storage deliveries
- 51 million feet
- Yardi Matrix national self-storage reports and supply forecasts, including the February 12, 2026 revision2026 forecast
- Self-storage values below 2022 peak
- 21 to 22 percent
- Green Street, Commercial Property Price Index, self-storage seriesmid-2026
A lender-grade walkthrough of an SBA 7(a) acquisition-and-expansion mandate in self-storage, and why the pro forma built on the advertised street rate is wrong twice.
MMCG Invest, LLC | July 23, 2026
1. The Engagement: A Representative Mandate
The mandate that frames this case study is a composite, assembled from recurring fact patterns across MMCG's self-storage feasibility practice. No single client engagement is described, and no confidential information is disclosed. The numbers are illustrative but calibrated to July 2026 market evidence, all of it cited in the sources section.
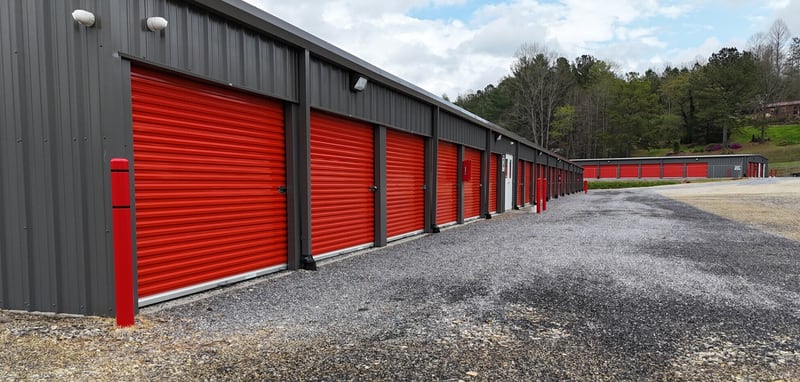
The subject is an 82,000 net rentable square foot, 560-unit self-storage facility in a secondary Southeastern metro, built in two phases in 1999 and 2006: single-story, drive-up, non-climate product on a fully utility-served site, with an entitled pad approved for a 12,000 square foot climate-controlled building that the sellers never built. The sellers are a retiring couple who have operated the property for twenty-two years, have not raised gate rates in three seasons, run no revenue management program, sell no tenant protection plan, and take rentals by telephone and walk-in. The buyer is an operator with two existing facilities, acquiring the going concern through an SBA 7(a) change-of-ownership loan that combines the real estate, the business, the climate-controlled expansion, and working capital in a single facility, with a third-party management platform engaged at closing.
Total project cost is $5,840,000: $4,050,000 for the acquisition, $1,430,000 for the expansion, $160,000 of working capital and funded interest reserve, and $200,000 of guaranty fee, closing, and soft costs. The proposed structure is a 7(a) loan at the $5,000,000 program maximum , priced at Prime plus 2.50 percent (9.25 percent at the current 6.75 percent Prime), amortized over 25 years, with an equity injection of $840,000. That is 14.4 percent of project cost, above the 10 percent SOP minimum, not by choice but because the loan cap binds first. Annual debt service is approximately $514,000, a loan constant of 10.3 percent.
Here is the fact that decides everything else in this study. The sellers' books show trailing net operating income of $494,000, which covers the proposed debt service at 0.96x. Almost. Normalized to institutional cost reality, with market management, a stepped-up tax bill, real insurance, and a capital reserve, trailing NOI is $348,000 and coverage is 0.68x. The books nearly cover; the truth does not come close. And this is not a defect peculiar to the subject. At 2026 capitalization rates and 2026 SBA pricing, essentially no stabilized self-storage acquisition at market value covers its debt service from trailing cash flow at full program leverage. The arithmetic is worked in Section 8. Every self-storage 7(a) written this year is, in substance, a projection loan, and that is precisely the circumstance in which SBA lending practice calls for an independent third-party feasibility study : when the projections the credit depends on exceed what history has demonstrated. This case study walks through what that feasibility study must prove.
2. Demand: The Move That Never Happened
The most common analytical error we encounter in self-storage credit files is the use of housing transactions as a proxy for storage demand. The logic feels sound: people rent storage when they move, so fewer moves should mean fewer tenants. Housing turnover is a flow. Storage demand is a function of a stock: the installed base of households already paying for a unit, plus a penetration rate that has climbed for two decades. The flow has collapsed. The stock has not moved.
The flow first, stated plainly. Existing home sales peaked at 6.12 million in 2021 and then fell off a cliff: 4.09 million in 2023, 4.06 million in 2024, and 4.06 million again in 2025, each of the last three years the lowest annual total since 1995, running roughly a third below the 2021 pace. The Census mover rate, above 20 percent of the population in 1985, has collapsed into the low 8 percent range, the weakest readings since the series began in 1948, held down by a mortgage lock-in effect under which more than half of outstanding mortgages still carry rates below 4 percent. If self-storage demand were a housing derivative, the industry should be in depression.
It is not. The Self Storage Association's Demand Study, the sector's benchmark household survey, counts 12.6 percent of US households renting storage in 2024, up from 11.1 percent in 2022, 10.6 percent in 2020, and 8.95 percent in 2005. Penetration rose straight through the deepest housing freeze in thirty years. Public Storage's same-store portfolio averaged 92.0 percent occupancy across 2025; Extra Space finished the first quarter of 2026 at 93.0 percent; the all-operator national figure sits in the low 80s. Tenants are not merely arriving; they are staying. Average length of stay reached 18.5 months by late 2025, and Extra Space reports that 64 percent of its tenants now remain longer than twelve months. Move-out activity, Public Storage told investors this spring, was meaningfully lower through the 2026 leasing season.
What happened is a decoupling, and it has a mechanism. A move still triggers a rental, but the move is no longer the reason the unit stays rented. Households that stopped moving did not stop accumulating; apartment-dwelling households formed without garages; small businesses shifted inventory into units; downsizing retirees stored what the smaller house could not hold. The New York City Department of City Planning, in the environmental record for its own storage restrictions, estimated 70 to 80 percent of units are leased by households and 20 to 30 percent by businesses, and neither cohort's need expires when the housing market seizes. Demand converted from an event into a subscription , and subscriptions are underwritten differently from events.
For underwriting, the conclusion is not "demand is fine." The conclusion is that a credit file citing home sales, in either direction, has not yet said anything about storage demand, and that demand must be decomposed into event-driven flow and seasoned stock before it can be underwritten at all. That decomposition is the work of Section 4.
- Existing home sales
- Storage penetration
The numbers behind this chart
| Category | Existing home sales | Storage penetration |
|---|---|---|
| 2005 | 7.08 | 8.95 |
| 2006 | 6.48 | |
| 2007 | 5.03 | |
| 2008 | 4.11 | |
| 2009 | 4.34 | |
| 2010 | 4.19 | |
| 2011 | 4.26 | |
| 2012 | 4.66 | |
| 2013 | 5.09 | |
| 2014 | 4.94 | |
| 2015 | 5.25 | |
| 2016 | 5.45 | |
| 2017 | 5.51 | |
| 2018 | 5.34 | |
| 2019 | 5.34 | |
| 2020 | 5.64 | 10.6 |
| 2021 | 6.12 | |
| 2022 | 5.03 | 11.1 |
| 2023 | 4.09 | |
| 2024 | 4.06 | 12.6 |
| 2025 | 4.06 |
The flow and the stock, July 2026 evidence base.
3. The Rate Record: What Softened and What It Proved
The street-rate record deserves to be stated plainly, because the discipline of this case study depends on not flinching from it. Advertised rates peaked with the 2021 to 2022 demand surge and have deflated ever since. Yardi Matrix's national blended advertised rate stood at $16.07 per square foot annualized in March 2026, down 2.0 percent year over year, with roughly seven in ten large cities still negative on the year as late as May. SpareFoot's transaction-weighted series is harsher: a national 10x10 rate of $74.98 in February 2026 against a July 2022 peak of $132.06, a 43 percent decline on that methodology. Public Storage signed new tenants in the fourth quarter of 2025 at $11.60 per square foot of annual contract rent, down 10.6 percent year over year, at levels management itself described as last seen in 2013. Between mid-2022 and late 2024 the average achieved move-in rate fell by roughly a third. That is a genuine cliff, and an honest feasibility study does not model it away.
What the same record proves, however, is the decoupling's financial half. Across the identical period in which move-in rates collapsed by a third, Public Storage's realized rent per occupied square foot rose to $22.53, its same-store occupancy climbed, and Extra Space's same-store revenue accelerated to positive 1.7 percent growth by the first quarter of 2026. Revenue did not follow the street rate down, because the advertised rate and the seasoned rent roll are two different markets. The street rate is the price of the next tenant. The book is the accumulated price of the last five years of tenants, seasoned by systematic in-place increases, and the book is where the money lives.
For underwriting, the conclusion is not that rates will recover, although the market bottom now visible in the monthly data suggests they are trying. The conclusion is that "the rate" is not one number, and a credit file that quotes one rate without saying which one has made an error of category, not of estimate. Rate must be decomposed by the tenure of the dollar: move-in, in-place, realized. That is Section 4, and it is the center of this study.
4. The Two Rents: Street Rate Is Not Revenue
A self-storage facility runs on two rents. The first is the advertised street rate, the public price of a vacant unit, set low and discounted lower to win the next move-in. The second is the in-place contract rent, the price the seasoned book actually pays, built tenant by tenant through existing-customer rate increases after move-in. The distance between them is not a market inefficiency. It is the business model.
The disclosures make the point with unusual precision, and the definitions matter more than the numbers. Public Storage reports, for the fourth quarter of 2025: average annual contract rent per square foot for tenants moving in of $11.60; for tenants moving out, $20.12, a 42 percent roll-down every time a seasoned tenant is replaced by a new one; in-place contract rent per occupied square foot of $22.55 at year end; and realized rent, net of promotions, of $22.53. In 2020 the in-place book stood roughly 27 to 32 percent above the move-in rate. By the fourth quarter of 2025 the premium had widened to 73 percent against departing tenants and 94 percent against arriving ones. Meanwhile the most quoted number in the sector, the Yardi advertised rate of $16.07, sits 30 to 40 percent below what the largest operator's occupied square footage actually pays. Three rates, one asset class, and a vocabulary problem that sinks credit files .
The machine that builds the spread is the existing-customer rate increase, the ECRI. The operator acquires the tenant at a teaser: a $1 first month, an online discount that averaged 17 percent through 2024 and peaked near 20 percent. The first increase commonly lands three to six months after move-in, with subsequent increases every six to twelve months, and the tenant, facing the friction of physically relocating stored goods, overwhelmingly pays rather than moves. Length of stay of 18.5 months and rising is the elasticity evidence. This is why the same quarter can show falling street rates and rising revenue, and why the practice has now drawn regulators: New York City's consumer protection agency sued Extra Space over its pricing pattern in February 2026, a matter that settled for $1.7 million, and California's amended automatic-renewal law took effect in July 2025. Section 9 prices that tail. The point here is mechanical: ECRI cadence and length of stay, not the advertised rate, are the revenue engine.
The two-rents structure produces two symmetric underwriting errors, and we see both weekly.
Error A prices a stabilized book at the street rate and understates it. Take a 70,000 square foot facility at 90 percent occupancy: 63,000 occupied feet at the true in-place rent of $22.53 is $1,419,000 of revenue; at the advertised $16.07 it is $1,012,000. The pro forma has erased $407,000, about 29 percent of revenue, and because operating costs are largely fixed, nearly all of it out of NOI. Capitalized at 6.5 percent, that single substitution misstates value by roughly $6.3 million on one mid-sized property.
Error B prices a lease-up at the in-place rent and overstates it by a multiple. A new facility's first-year book is 30 to 40 percent occupied at deeply concessed move-in rates near $12, not 90 percent occupied at $22.53. Underwriting year one at the stabilized in-place assumption overstates first-year revenue by three to four times, and capitalizing that spurious NOI on day one is how construction loans made in 2021 became the watchlist entries of 2026.
The correct discipline is to underwrite the seasoned book to its own trailing realized rent per occupied square foot and RevPAF, verified against the REIT-disclosed in-place rent for the subject's own metro, and to underwrite a lease-up on a multi-year fill curve at concessed move-in rates with ECRI layered onto the seasoning cohorts, converging to in-place only at stabilization. Economic occupancy, not physical, in both cases: a facility can post 90 percent physical occupancy with economic occupancy in the high 70s once concessions, delinquency, and the street-to-book gap are netted.
There is a second revenue architecture stacked on the first: ancillary income, led by the tenant protection plan. It is small on the top line and enormous in the profit mix, running at roughly 90 percent gross margin. Public Storage's tenant reinsurance business produced $192 million of NOI in 2025, up 82 percent since 2019, on 1.5 million certificates; Extra Space collected $353 million of reinsurance revenue, about 11 percent of its rental-plus-reinsurance top line. Well-run independents report total ancillary of 12 to 18 percent of revenue, an operator-reported figure we treat as an estimate rather than an audit. The subject sells none of it.
And that is the subject's diagnosis in a single comparison. At the REITs, the in-place book sits far above the street. At the subject, in-place rent of $9.60 per square foot sits 13 percent below the local street rate of roughly $11.00 for comparable drive-up product. Twenty-two years of goodwill pricing has inverted the sector's defining spread: the facility is 93 percent physically full precisely because it is underpriced, with economic occupancy of 87 percent once delinquency and informal discounts are netted. The reposition thesis is therefore not a bet on the market. It is the installation of the standard machine on an asset that never had one: a disciplined ECRI program lifting the book from $9.60 toward $12.20 over thirty months, settling a modest 11 percent above street against REIT spreads several times wider; a protection plan and listing presence bringing ancillary from 3 percent of revenue toward 7.5 percent, credited far below the 12 to 18 percent operator claims; and the acceptance that a few points of physical occupancy will be traded away as the mispriced tail vacates. Stabilized Year 4 revenue of $1,100,000 against $706,000 trailing requires no heroic market assumption; it requires executing, at 560 units, exactly what the disclosures show the institutional operators executing every quarter.
The numbers behind this chart
| Category | Series 1 |
|---|---|
| Move-in contract rent | 11.6 |
| Advertised street rate | 16.07 |
| Move-out contract rent | 20.12 |
| Realized rent, net of discounts | 22.53 |
| In-place contract rent | 22.55 |
The two rents: what the next tenant pays vs what the book pays.
5. Supply: The Pipeline That Rolled Over, and the Wall Behind It
If demand has converted into a subscription and the revenue lives in the seasoned book, the durable question is supply, and here the evidence has turned decisively. Deliveries peaked at roughly 65 million net rentable square feet in 2024, about 3.3 percent of national stock. 2025 came in near 54 million, and Green Street's supply-growth series marked it the thinnest year in over a decade, with construction starts down 21 percent from their 2023 peak and first-quarter 2026 starts running 29 percent below the prior year. Yardi Matrix forecasts 51 million feet for 2026, 45 million for 2027, and under 39 million for 2028, roughly 1.7 percent of stock against a 4.2 percent long-run average. One honesty is owed here: Yardi raised its 2026 forecast by 6 percent in a February revision as late-reporting projects surfaced, which is a standing feature of this dataset, and a feasibility study should treat pipeline figures as floors, not ceilings.
The property-level translation comes from Extra Space , which discloses the share of its same-store pool receiving a new competitor in the trade area: an average in the high twenties percent across 2021 to 2023, then 13 percent in 2024, 8 percent in 2025, and a projected 6 percent in 2026. Because each new competitor suppresses its neighbors for the three to four years of its own lease-up, single-digit delivery years compound: the pressure that defined 2022 to 2024 is not merely easing, it is aging out of the system.
The reasons starts collapsed are the reasons they will not quickly return. Construction costs absorbed the Section 232 steel and aluminum tariffs, doubled to 50 percent in June 2025, on a product type that is substantially a pre-engineered steel building: steel mill products were up more than 20 percent year over year by January 2026. Street rates deflated while costs inflated, so the development spread died: contractor data puts core-market yield on cost near 7.5 percent against going-in caps in the mid-5s to low-6s, a 150 to 250 basis point spread that a single overrun erases. Values reset 21 to 25 percent from peak on Green Street's index while replacement cost climbed toward $161 to $238 per net rentable foot, leaving existing product trading near $159 per foot on average, far below what it costs to build. Time-in-planning hit a record 583 days; abandoned projects doubled in 2023. When buying is this far below building, rational capital buys, which is the subject's entry logic in one sentence.
Behind the economics stands a wall that was not there five years ago: a spreading, named, dated record of municipal restriction. Chicago removed self-storage as a by-right use from its business and commercial districts in May 2025 by ordinance , confining new facilities to manufacturing and downtown-service zones and converting every existing facility in the removed districts into a legal nonconforming use. Providence banned new self-storage citywide in July 2023 under the council's slogan of housing people, not things. New York City has required a City Planning Commission special permit in its Industrial Business Zones since 2017, a regime its 2024 citywide zoning overhaul deliberately preserved. Atlanta, which led the nation with 2.2 million square feet delivered in 2025, imposed a moratorium by mayoral executive order in June 2026, made 180 days by unanimous council vote in July. Cape Coral converted a 2023 moratorium into permanent code: one mile between facilities, 500 feet from major intersections, a mixed-use component, no ground-floor units. Punta Gorda, Toledo, Wetumpka, Cashmere, Rockdale County, Delta Township, Mandan, and Yonkers ran their own versions between 2024 and 2026; Miami enforces a 2,500-foot separation; Denver bars storage within a quarter mile of light rail; Thousand Oaks caps sites at two acres. Denials of specific projects reached the record in Old Bridge, Santa Clarita, Rockford, Suffolk, and Avondale, with the Old Bridge denial now in litigation. The rationale is the same everywhere: few jobs, little sales tax, dead frontage. Honesty requires the counterweight: Greensburg and Parkland liberalized, Texas and Florida suburbs remain by-right with permits in three to eight weeks, and the sample skews toward jurisdictions the trade press watches. The trend is real,
concentrated, and spreading, not universal.
The underwriting translation is direct. Every one of these barriers is a cost the incumbent has already paid. An entitled, utility-served, operating facility with an approved expansion pad holds a franchise that a competitor needs six to twenty-four months of discretionary approvals, a dead development spread, and tariff-priced steel to replicate, and in the ban jurisdictions cannot replicate at any price. That franchise, not the 2021 rate spike, is what the lender's collateral actually consists of.
One discipline governs how supply enters the model: the trade area, never the metro. Square feet per capita, the sector's saturation shorthand, ranges from 5.9 to 7.8 nationally depending on whose facility universe and whose population base is used , with rough equilibrium near 7 and oversupply flagged above 8 to 9. The subject's metro reads 8.9 square feet per person, a number that would kill the deal in a screening model. The subject's three-mile ring, where Newmark's benchmark says at least 65 percent of customers originate, contains nine facilities totaling roughly 262,000 net rentable feet against 41,000 residents: 6.4 feet per capita, nothing under construction, nothing delivered since 2019, and one planned project four miles out that prudent practice discounts heavily given record planning timelines. The metro number and the ring number point in opposite directions, and only the ring number describes the asset. The error cuts both ways: metro averages would equally have blessed a site in a 17-feet-per-capita Texas overhang. A feasibility study that quotes per-capita supply without naming the universe, the geography, and the pipeline treatment has produced a number, not an analysis.
The pipeline rolled over, and the wall behind it.
6. Lease-Up, Seasonality, and the Months That Decide the Loan
Annualized stabilized figures flatter every projection loan, and in storage the flattery concentrates in two places: how fast the new square footage fills, and when in the calendar the dollars arrive.
On fill speed, the feasibility record is unusually consistent. Well-located facilities absorb 2 to 4 percent of net rentable footage per month; the conservative planning case is 2 to 3 percent; and a 50,000-plus square foot facility now takes three to four years to reach the 85 to 90 percent physical occupancy the sector calls stabilized. Public Storage's own annual report puts the stabilization period at typically three to five years. The 2021 exception, when properties leased in twelve to eighteen months, was described by one veteran third-party manager as the only time in twenty-two years it had ever happened, and pro formas built on that vintage are precisely the loans now filling the watchlists. The subject's 12,000-foot expansion is modeled at 2.5 percent per month to 87 percent economic occupancy in roughly 35 months, and its street rates carry the concession load, an average online discount near 17 percent, through the fill.
Stabilization itself needs one definitional paragraph, because the sector runs three incompatible versions . Operators and appraisers mean a physical occupancy level, commonly 85 to 90 percent. The REITs' same-store pools are defined by time, owned and stabilized since a fixed January 1, not by an occupancy trigger. And neither is economic stabilization: a facility can hit 90 percent physical while its newest cohorts sit on teaser rates, so ECRI-seasoned, rate-mature revenue arrives twelve to twenty-four months after the occupancy headline. A pro forma that capitalizes stabilized rents on the day physical occupancy crosses 88 percent has quietly pulled a year of revenue forward.
Seasonality does the same thing inside each year. June alone accounted for 13.7 percent of national reservations in 2025, with May and August near 11 percent each and the first quarter the trough; street rates slide roughly 5 to 7 percent from summer peak to December. The note, meanwhile, amortizes in twelve equal installments. The scheduling consequence is real money: a facility receiving its certificate of occupancy in September opens into the trough and can add six months of effective carry. The subject's expansion is sequenced to break ground in month four and open in month fourteen, an April opening into the leasing season, which is not an aesthetic choice but a debt-service one.
The credit record rewards the caution without justifying panic. Self-storage remains the best-performing CMBS property type , with delinquency near 0.1 percent as of late 2025 against 6.6 percent for the market. But nearly 30 percent of outstanding storage CMBS balances now sit on servicer watchlists, concentrated brutally by vintage: 84 percent of the 2023 vintage, 57 percent of 2024, and by market, roughly half of Atlanta and Chicago balances. Only 0.84 percent of balances run below 1.0x coverage. Read together, the data say the asset class is not failing; a specific assumption set is. Loans underwritten to 2021 fill speeds and 2022 street rates are aging badly, and loans underwritten to the observed 36-to-48-month reality are not.
The subject's own coverage path is stated plainly rather than annualized away: 0.83x in Year 1 as the first ECRI wave lands and the expansion is under construction, 1.00x in Year 2 as the building opens, 1.16x in Year 3, and 1.26x at stabilization in Year 4. The first two years do not cover from operations, which is exactly why the structure carries a funded interest reserve and working capital inside the loan, and why the study says so on its face. A feasibility study that hides the uncovered months inside an annual average has not de-risked them; it has merely declined to reserve for them.
7. The Operator and the Asset: Normalization and Execution as Underwritten Inputs
Two diligence workstreams decide whether the Section 4 projections are entitled to exist.
The first is physical and contractual. The expansion pad's utility service is verified with the providers in writing, not inferred from the site plan; the climate building's fire-suppression and electrical requirements are confirmed against current code, since the pad was entitled under an older cycle; and the existing plant is life-cycled at acquisition, roofs, roll-up doors, paving, gates, and camera systems each carrying a dated replacement horizon behind the $0.17 per square foot annual reserve. Insurance is underwritten from the actual binder, never a percentage rule of thumb. The hard market of 2023, when catastrophe-exposed storage renewals ran up 40 percent, has softened, with US commercial property rates falling 8 percent in the fourth quarter of 2025 , but the structural retentions remain: percentage wind and hail deductibles of 1 to 5 percent of insured value in the subject's region, and roof endorsements that pay depreciated rather than replacement value. On a facility whose collateral is substantially roof and door, a 2 percent named-storm deductible is a $40,000-per-million retained loss, and the study sizes a reserve against it rather than an adjective.
The second is financial normalization, and in this asset class it is where mom-and-pop books go to die. The sellers' 30 percent expense ratio is not fraud; it is a couple paying themselves nothing, marketing nothing, carrying a 2006 assessment and a legacy insurance policy. The benchmark reality is two-track: REIT same-store ratios run 25 to 31 percent of revenue, but those figures exclude the roughly 6 percent management fee an independent owner must pay, and the owner-operator full-load band is 33 to 38 percent, with the sector's survey anchor at 34.68 percent. Normalization therefore adds third-party management at 6 percent of collections, on-site staffing for a hybrid remote model, real marketing in a sector where the customer acquisition war is fought online , an insurance true-up, the capital reserve, and, largest of all, property taxes reassessed to roughly 85 percent of the purchase price at the local millage rather than trended off the sellers' bill, the single most common and most expensive modeling error we correct in third-party projections. Book NOI of $494,000 restates to $348,000.
One arithmetic subtlety in that restatement deserves daylight, because reviewers trip on it. Normalized expenses are 50.7 percent of trailing revenue, far above the 33 to 38 percent band, and the band is not wrong; the denominator is. The facility is under-rented by design of its previous owners, so the same expense dollars measured against stabilized revenue come to roughly 41 percent, inside the band once reserves are carried. An expense ratio is a fraction, and a feasibility study must state which revenue it divided by, or the benchmark comparison is theater.
Management execution is underwritten the same way: as priced actions, not platform halo. Third-party managers advertise revenue lifts, and the claims are correlational, confounded by the self-selection of better assets into professional management. The study credits no generic lift. It credits the ECRI program at a stated cadence and magnitude, the protection plan at a stated attach rate, and the listing presence at a stated marketing cost , each benchmarked to disclosed operator practice, and it names the contingency: the third-party agreement's fee, term, and termination mechanics sit in the file, alongside the buyer's two-facility track record, because a self-storage facility is a retail business with 560 customers, and the SOP's insistence on management capability in change-of-ownership credits is not a formality here.
8. Capital Markets and the Financing Architecture
The valuation context frames both the entry basis and the exit. Green Street's price index puts self-storage values 21 to 22 percent below their 2022 peak as of mid-2026, with the trough marked in the second quarter of 2025 and two consecutive quarters of gains since; the commonly quoted 25 percent figure is the same series read over twelve quarters. Cushman & Wakefield's transaction sample tells the same story in dollars: an average $174 per square foot at the 2023 peak declining to $159 by mid-2025. Stabilized capitalization rates run 5.0 to 6.0 percent for Class A, roughly 6.5 to 8.0 percent for Class B, and 8 to 10 percent for Class C and tertiary product, off a 5.0 percent record low in late 2022. Volume is recovering from a standstill: roughly $5 billion traded in 2025, up 39 percent, and the buyer base tells an underwriter something important. Non-REIT buyers, private operators like the subject's, made 82 percent of acquisitions at an average $111 per foot, while REITs paid $153. Consolidation is proceeding above them: Public Storage agreed in March 2026 to acquire National Storage Affiliates at roughly $10.5 billion enterprise value, taking its US share past 14 percent, a pending transaction that deepens the institutional exit bid for stabilized, professionalized product.
On the debt side, the structural fact is that the agencies are absent: Fannie Mae and Freddie Mac finance apartments and manufactured housing and exclude self-storage entirely. The market is banks at 5.75 to 7 percent, life companies below that, conduit CMBS at 6.25 to 7 percent with 65 to 70 percent leverage and coverage floors near 1.30x, debt funds for transitional product, and, for the owner-operator segment below roughly $15 million of project cost, the SBA. That absence of agency debt is why the 7(a) and 504 are the market-standard instruments for a deal like the subject rather than a fallback.
The SBA architecture rewards precision, because three technical points are chronically gotten wrong. First, eligibility. Self-storage is a passive-looking business that is nonetheless SBA-eligible, via the storage-services exception to the passive-business rule of 13 CFR 120.110(c), a treatment in place since the October 2010 SOP and carried into the current SOP 50 10 8, effective June 1, 2025. There is no 30-day transient-revenue test here, unlike RV parks, campgrounds, and hotels; what the file must document instead is an operating business, meaning active management, month-to-month service arrangements, and ancillary services, rather than passive net-lease rent collection. Second, classification. Self-storage does not appear on the SBA's limited-or-special-purpose property list; it is multipurpose, which means the standard 10 percent minimum equity injection applies to an established change of ownership, not the 15 percent rate that some lenders reflexively attach. Misclassifying storage as special purpose and over-injecting equity is the most common structuring error in the asset class. Third, the seller note: it counts toward the injection only on full standby for the life of the loan, and only up to half of the requirement. The FY2026 fee notice prices the guaranty at 3.5 percent of the first million of guaranteed exposure and 3.75 percent above, capitalized in the uses here, and a July 2026 policy change doubled the cumulative 7(a)-plus-504 limit per borrower to $10 million, opening a path for the subject's operator to finance a second project, though the single 7(a) remains capped at the $5 million this structure exhausts. For larger stabilized storage, the 504's debentures priced near 6.2 percent this summer, a blended constant around 8.4 percent that materially softens what follows.
Because what follows is the arithmetic honesty owed to the credit committee, and in 2026 self-storage it is stark. A 7(a) at 9.25 percent over 25 years carries a loan constant of 10.3 percent. Set that against the capitalization rates above and the conclusion is unavoidable: entry leverage is negative for institutional-quality storage, and not by a little. A Class B asset bought at a 6.0 percent cap and financed at 70 percent leverage produces a debt yield of 8.6 percent against a 10.3 percent constant, coverage of roughly 0.82x, before the SBA's higher leverage makes it worse. Stabilized in-place storage NOI cannot service a full leverage 7(a) at market pricing anywhere on the quality curve. Positive leverage in this asset class does not arrive at closing through the coupon spread; it is earned afterward through NOI growth and 25 years of amortization, or it never arrives. That is the structural reason every storage 7(a) is a projection loan, and the structural reason the feasibility study, not the appraisal alone, carries the file.
The subject's version of that arithmetic is the deal's defense. The entry is a 8.6 percent capitalization rate on normalized trailing NOI, wide of the Class C benchmark because it is an off-market estate sale of an under-managed asset, at $49 per net rentable foot against replacement cost of $161 to $238, and a blended all-in basis of $62 per foot including the expansion. Even so, trailing coverage is 0.68x: the negative-leverage regime spares no one at entry. What the structure buys is the bridge and the destination. Stabilized NOI of $649,000 is a 13.0 percent debt yield against the 10.3 percent constant, clearing by 270 basis points the 100-to-150 basis point cushion we regard as the minimum standard for storage projection credits. At a deliberately conservative 8.25 percent exit capitalization rate, stabilized value approaches $7.9 million, placing the $5.0 million loan below 65 percent of stabilized value: the reversion cushion that compensates the lender for the entry coverage, and the margin that survives the bear case in Section 9.
- SBA 7(a) loan
- Equity injection
- Acquisition of the going concern
- Climate-controlled expansion
- Working capital and interest reserve
- Guaranty fee, closing and soft costs
The numbers behind this chart
| Category | SBA 7(a) loan | Equity injection | Acquisition of the going concern | Climate-controlled expansion | Working capital and interest reserve | Guaranty fee, closing and soft costs |
|---|---|---|---|---|---|---|
| SOURCES | 5 | 0.84 | ||||
| USES | 4.05 | 1.43 | 0.16 | 0.2 |
9. Risk Framework: Tripwires and the Bear Case
A feasibility study that cannot state its own bear case is marketing . Ours is the following, and its first element is the one nobody prices: the housing market recovers. The seasoned-book economics of Section 4 are partly a lock-in artifact; a mobility thaw would shorten length of stay, re-arm move-out elasticity against ECRI, and hand pricing power back to the street rate at exactly the moment new supply becomes cheap to start again. In storage, the paradox is real: the demand event everyone roots for is a headwind to the book. Layer onto it the regulatory tail on the two highest-margin lines. The ECRI machine is now named in enforcement actions: New York City's suit against Extra Space settled for $1.7 million in 2026, California's automatic-renewal law tightened in 2025, roughly thirty jurisdictions run lookalike statutes, and California's price-gouging law, which expressly covers storage services, capped increases at 10 percent across Los Angeles County for a full year after the January 2025 wildfires, a restriction Public Storage guided to an 80 basis point same-store revenue drag. The protection plan carries the same shape: lawful contractual product in California under Heckart, treated as unlicensed insurance by regulators in Louisiana and New Mexico, and the subject of a $250,000 California fine against one operator and a $5 million class settlement against another. And the operational floor: the Servicemembers Civil Relief Act makes a storage lien sale against a servicemember without a court order a strict-liability federal violation with a documented consent-order price of $60,000 to $170,000, which is why a DMDC verification workflow is a condition of this credit, and why lien mechanics, which several Northeastern states have kept slow and formal while twenty-odd states modernized, set the bad-debt reserve state by state.
Under the combined stress, ECRI capped at 5 percent annually and settling at street with no premium, the expansion filling in 48 months instead of 35, and the protection plan credited at half, stabilized NOI falls to roughly $563,000 and coverage to 1.10x. The credit survives it for one reason only: the entry basis. At an 8.6 percent going-in cap and $49 per foot, the deal carries the stress; the identical business plan purchased at a 6.75 percent cap does not. In 2026 self-storage, basis is the risk decision.
Tripwires and mitigants.
Outlook: What the Feasibility Study Must Prove
The 2026 setup for self-storage credit is, in our judgment, more attractive than the 2021 setup that attracted the tourist capital, precisely because the froth is gone. Street rates have deflated to a visible floor, values have reset 21 to 25 percent, the development spread is dead, the pipeline is rolling toward half its long-run pace behind a spreading entitlement wall, and the buyer of last resort is consolidating above the market. What remains is the durable architecture: a penetration base that climbed through the worst housing freeze in thirty years, a seasoned-book revenue machine whose mechanics are disclosed quarterly by the operators who invented it, and an entry environment in which an under-managed asset can still be bought below replacement cost at a capitalization rate wide enough to survive its own bear case.
The self-storage feasibility study's burden in this environment is specific. It must decompose demand into flow and stock rather than citing housing statistics in either direction. It must decompose rate by the tenure of the dollar, and refuse both errors: never the street rate on a seasoned book, never the in-place rent on a lease-up. It must underwrite economic occupancy, not the physical headline. It must reassess taxes to the purchase price, normalize the books to full-load cost, and say which denominator its expense ratio divides by. It must model the three-mile ring and not the metro, count all of the under-construction pipeline and a discounted fraction of the planned. It must schedule the fill against the calendar and reserve for the months and years that do not cover. It must price the regulatory tail on the two highest-margin lines instead of capitalizing them as free money. And it must state the trailing coverage plainly, 0.68x in this composite against books that claimed 0.96x, and then demonstrate, step by auditable step, why the stabilized 1.26x is earned rather than asserted. That is the standard to which this practice holds its own work, because it is the standard on which a credit committee is entitled to insist.
MMCG Invest, LLC is a national commercial real estate feasibility consulting firm serving SBA 7(a), SBA 504, USDA, and conventional lenders across more than thirty asset classes, with a self-storage practice spanning stabilized acquisitions, expansions, conversions, and ground-up development. Our studies are prepared for lender reliance and structured to SBA SOP standards. To discuss a self-storage mandate, contact us through mmcginvest.com .
Author: Michal Mohelsky, J.D., Principal, MMCG Invest, LLC
Michal Mohelsky, J.D. | Principal | mmcginvest.com
Contact: michal@mmcginvest.com
Phone: (628) 225-1110
Disclaimer: This report is provided for informational purposes only and does not constitute investment, legal, or tax advice. Data presented herein is derived from proprietary MMCG databases and third-party sources believed to be reliable; however, MMCG Invest makes no representation as to the accuracy or completeness of such information. Figures from third-party industry databases have been independently verified and, where appropriate, adjusted to reflect MMCG's proprietary analytical methodology. Statutory and regulatory references are provided for context and must be verified with counsel before reliance. Past performance is not indicative of future results.
Sources
1) Public Storage, FY2025 Annual Report (Form ARS, filed March 2026), Q4 2025 earnings release, and 8-K operating updates, late 2025 through mid-2026
2) Extra Space Storage, Q4 2025 and Q1 2026 earnings materials, including the April 30, 2026 call on same-store supply exposure
3) CubeSmart, FY2025 Form 10-K (filed February 2026) and Q1 2026 release
4) National Storage Affiliates, Q4/FY2025 8-K; Public Storage / NSA merger agreement, March 16, 2026
5) SmartStop Self Storage REIT, 2025 to 2026 releases
6) Yardi Matrix, National Self-Storage Reports and supply forecasts, January to June 2026, including the February 12, 2026 forecast revision
7) StorageCafe / RentCafe self-storage supply and monthly rate reports, 2026; SpareFoot / Storable rate series, 2022 to 2026
8) Self Storage Association, Self Storage Demand Study, 2025 edition (C+R Research; 2024 data)
9) Green Street, Commercial Property Price Index, self-storage series, 2022 to mid-2026
10) Cushman & Wakefield, U.S. Self-Storage Market Trends & Outlook, H1 2025 (Real Capital Analytics data)
11) Newmark / Self-Storage Almanac, 2024 and 2025 editions (Modern Storage Media; Radius+ data); Self-Storage Expense Guidebook, 2024 edition
12) TractIQ, occupancy and REIT rate reports, 2025 to 2026
13) KBRA, "Self-Storage: The Shifting Landscape," October 14, 2025; Trepp CMBS delinquency and watchlist data, 2025 to July 2026
14) Terrapin Construction Group, self-storage cost and permitting data, May 2026; Section 232 tariff proclamations, 2025 to 2026
15) U.S. Small Business Administration: SOP 50 10 8 (effective June 1, 2025); 13 CFR 120.110 and 120.111; Information Notice 5000-872051 (FY2026 fees); Policy Notice 5000-879058 (May 18, 2026)
16) Municipal records and ordinances: Chicago Ordinance O2025-0016754 (May 2025); Providence zoning amendment (July 2023); NYC N 170425(A) ZRY (2017) and 2024 City of Yes materials; City of Atlanta executive order (June 24, 2026) and council moratorium (July 6, 2026); Cape Coral Ordinance 15-24 lineage; local-government and trade-press records of additional moratoria and denials, 2022 to 2026
17) NYC Department of Consumer and Worker Protection v. Extra Space Storage, filings and settlement releases, 2026; California Department of Insurance enforcement materials, 2020; California Penal Code section 396 and January 2025 Los Angeles emergency orders; state self-service storage facility acts as amended 2023 to 2026
18) National Association of Realtors, existing-home sales, 2019 to 2025; U.S. Census Bureau, CPS geographic mobility series
19) Marsh, Global Insurance Market Index, Q4 2025; Council of Insurance Agents & Brokers, Commercial P&C Market Index, Q1 2026
20) Named feasibility and management practice sources on absorption and stabilization, including Storage Asset Management, IRE LLC, Donald Jones Consulting, and DXD Capital, 2022 to 2026
21) MMCG database, July 2026

Michal Mohelsky, J.D., FMVA, Practicing Affiliate of the Appraisal Institute
Principal, MMCG Invest, LLC
Published July 23, 2026. How this analysis was prepared.
Cite this
Michal Mohelsky, J.D., FMVA (2026). Feasibility Case Study: Analyzing Self-Storage After the Move That Never Happened. MMCG Invest, LLC. https://www.mmcginvest.com/post/feasibility-case-study-analyzing-self-storage-after-the-move-that-never-happened
Where this goes next
- SBA Feasibility StudyMMCG's feasibility study page for this subject.