
Aldi vs. Lidl in 2026: A Comparative Analysis of the U.S. Hard-Discount Grocery Market

On January 12, 2026, Aldi U.S. said it would open more than 180 stores during the year, enter Colorado, make Maine its 40th state, and reach roughly 3,200 U.S. locations by the end of 2028 (1). It had closed 2025 with 2,614 stores (2). Four months later, on the other side of the same format, Lidl U.S. named its sixth chief executive in eleven years, and by September it was describing its footprint as "more than 200 stores across nine East Coast states" (3, 4). Two German hard discounters, both privately held, both selling a similar basket out of a similar box, entered the same country and produced a gap of about 13 to 1 in store count. Aldi took fifty years to build its side of that gap. Lidl took nine years to build the other.
The consumer press treats the two chains as a matched pair and argues about which one has the better croissant. That framing is useless to anyone who has to underwrite a site. For a developer, a net-lease buyer or a lender, Aldi and Lidl are not one story. They are two different real estate strategies that happen to share a merchandising model, and the difference shows up in acres, square feet, lease terms and capital committed per store. This analysis assembles every documented number that exists for that comparison, and says where the record stops.
It works through nine dimensions: corporate structure and market context, the store universe and growth record, the box and its site criteria, tenure and capital, financial performance, the Lidl U.S. post-mortem, the evidence on what a discounter does to a trade area, lending and net-lease implications, and the outlook through 2030 with Europe as the end state. It draws on company releases from Aldi U.S., Lidl U.S., the Schwarz Group and the two Albrecht groups; the audited UK accounts of Aldi Stores Limited and Lidl Great Britain Limited, which are the most complete audited window into either operating model anywhere; SEC filings from Kroger, Sprouts and the net-lease REITs as benchmarks; the peer-reviewed literature on discounter entry; the SBA's 7(a) and 504 loan files; and the MMCG database. Readers of our earlier comparative work, Costco vs. Sam's Club and Whole Foods vs. Sprouts, will recognize the format. The difference here is that neither company files with the SEC, so we say, throughout, which numbers are audited, which are company statements, and which are somebody's estimate.
1. Market Context: Two Private Empires, One Uneven U.S. Presence
Start with who actually owns what, because the popular version is wrong more often than not. There are two Aldis. Aldi Süd and Aldi Nord have been legally separate since the Albrecht brothers divided the business around 1960 to 1961, and each is held by its own set of family foundations (5). The Aldi that trades in the United States is an Aldi Süd business: ALDI Inc., an Illinois corporation headquartered in Batavia, outside Chicago (6). Trader Joe's, which shoppers routinely assume is "the same company," sits on the Aldi Nord side of the family and has nothing to do with the Batavia operation (5). Lidl is a different animal again. Lidl U.S., LLC is a Delaware limited liability company with its principal place of business in Virginia, wholly owned by Lidl Stiftung & Co. KG, a fact best documented not in a press release but in a 2024 federal court opinion in the Eastern District of Pennsylvania (7). Lidl Stiftung in turn belongs to the Schwarz Group of Neckarsulm, which also owns the Kaufland hypermarket chain.
The parents are enormous and opaque in roughly equal measure. The Schwarz Group reported €185.6 billion of revenue for the fiscal year ended February 28, 2026, of which Lidl's stores contributed €140.2 billion and Kaufland €36.7 billion, across about 14,500 stores in 33 countries and 604,000 employees (8). It says it invested around €9 billion in the year and plans more than €10 billion in the next (8). Aldi Nord reported preliminary net retail revenue of more than €31 billion for 2025 across 5,526 stores in eight countries, with about €1.5 billion invested (9). Aldi Süd's last figure confirmed by named press citing company publications is €83 billion for 2023 (10). None of the three publishes a profit figure. None carries a public credit rating from Moody's, S&P or Fitch. The only reported capital-markets transaction by any of them is a private placement of about $1.8 billion by Schwarz in May 2024, reported by Bloomberg Law from unnamed sources (11). For a lender, this matters more than it might appear: a chain with 14,500 stores and no public rating is not an investment-grade tenant in the sense that Walmart or Kroger is, however strong its balance sheet may actually be.
The U.S. numbers are where the fog is thickest. The most-cited figure for Aldi's U.S. sales is Kantar's estimate of $58.36 billion for 2025, published in the National Retail Federation's Top 100 (12). Read the footnote and the number dissolves: it includes Trader Joe's and the Winn-Dixie and Harveys stores Aldi acquired in 2024. Strip out Trader Joe's, which is variously reported at $21.5 billion to $25 billion, and Aldi U.S. proper lands somewhere between $33 billion and $37 billion (12, 13; MMCG computation). Lidl U.S. does not appear in the Top 100 at all. Since the hundredth entry, Save-A-Lot, is listed at $4.06 billion, Kantar's method implies Lidl's U.S. sales are below that (12). Neither retailer has ever confirmed a U.S. revenue figure. Everything in Exhibit 1.1 that carries a dollar sign for either chain is an estimate and is labelled as one.
Exhibit 1.1: The Two Groups and Their U.S. Operations, Latest Available
Metric | Aldi (U.S. side) | Lidl (U.S. side) |
U.S. operating entity | ALDI Inc., Illinois corporation, Batavia, IL | Lidl US, LLC, Delaware LLC, Arlington, VA |
Parent | Aldi Süd (Albrecht family foundations) | Lidl Stiftung & Co. KG, Schwarz Group |
Parent group revenue | Aldi Süd: €83 billion (2023, company via press) | Schwarz: €185.6 billion; Lidl stores €140.2 billion (FY to Feb 2026) |
Parent global stores | Aldi Süd: no consolidated count published; Aldi Nord 5,526 | ≈ 14,500 Lidl and Kaufland, 33 countries |
U.S. entry | 1976, Iowa City | June 2017, Virginia and the Carolinas |
U.S. stores | 2,614 (Dec 31, 2025) | "more than 200" (Sept 2026); state agency: "more than 185" (Aug 2026) |
U.S. states | 39 plus DC; Maine 40th in 2026 | 9 plus DC |
U.S. sales | ≈ $33 to $37 billion ex-Trader Joe's (MMCG from Kantar) | < $4.06 billion (implied by NRF Top 100 cut-off) |
Public credit rating | None | None |
SEC filings | None | None |
Source: Aldi U.S. and Lidl U.S. press releases; Schwarz Group FY2025 release; Handelsblatt; WirtschaftsWoche; Kovalev v. Lidl US, LLC (E.D. Pa. 2024); NRF/Kantar Top 100 Retailers 2026; VEDP; MMCG database. Dollar figures for both chains are estimates.
The channel these two operate in is, by the numbers, the growth end of American grocery. Placer.ai put Aldi at 5.7 percent of all U.S. grocery visits in the first quarter of 2025, and its first-half 2025 visit growth at 7.1 percent against 4.9 percent for Lidl and 11.9 percent for Trader Joe's (14). The USDA's Economic Research Service records that warehouse clubs and supercenters took their share of food-at-home spending from 9.4 percent in 1997 to 26.4 percent in 2025 while traditional grocery fell from 72.2 percent to 56.2 percent (15). Hard discount is the format eating from the other end of the same plate, and the ERS data on local concentration explains why it can: the 2019 grocery Herfindahl index was 593 nationally but 3,737 at county level, up 94 percent since 1990 (16). Local markets are concentrated enough that a fourth or fifth operator with a structurally lower cost base finds room almost anywhere. The question this report is really about is why one of the two German operators found that room 2,614 times and the other found it 200 times.
2. The Store Universe: A 13-to-1 Gap and How It Was Built
Aldi crossed 2,000 U.S. stores in the summer of 2020, was at 2,361 in March 2024, "over 2,400" at the end of that year, and 2,614 on December 31, 2025 (2, 17, 18). It opened "nearly 200" stores in 2025, its largest single-year count, and says it will end 2026 at "nearly 2,800" (1, 2). Lidl opened its first nine stores on June 15, 2017, had 47 by December of that year, 59 in November 2018, 103 after three years, more than 170 in October 2022, and celebrated its 200th store, in Brooklyn, in 2026 (19, 20, 21, 22, 23). The two curves are not merely different in slope. One is a straight line and the other is a stall.
Exhibit 2.1: U.S. Store Count Trajectory, 2017 to 2026
Date | Aldi U.S. | Lidl U.S. | Source note |
Mid-2017 | 1,600+ (June) | 9 (June 15 openings) | Aldi release; Convenience Store News |
Dec 2017 | n/d | 47 | Lidl spokesman via Supermarket News |
Nov 2018 | n/d | 59 (before Best Market's 27) | Lidl release |
Mid-2020 | 2,000+ | 103 ("first three years") | Supermarket News; VEDP |
Oct 2022 | 2,100+ | 170+ | Supermarket News; VEDP |
Mar 2024 | 2,361 | ≈ 173 (aggregator) | TODAY; Wikipedia (est.) |
Dec 2024 | "over 2,400" | n/d | Aldi release |
Dec 31, 2025 | 2,614 | ≈ 190 to 200 | CNBC; Grocery Dive |
Sept 2026 | ≈ 2,700 (est.) | "more than 200" | ScrapeHero (est.); Lidl release |
Source: Aldi U.S. releases (2017, 2024, 2025, 2026); Lidl U.S. releases (2017, 2018, 2020, 2026); Virginia Economic Development Partnership; Supermarket News; CNBC; MMCG database. Third-party scrapes for Aldi in September 2026 range from 2,605 to 2,687 and are recorded as estimates.
Two things about Aldi's record deserve more attention than they get. The first is that Aldi's announced targets are consistently late, and consistently delivered anyway. The December 2013 plan promised "nearly 2,000 by 2018" and the 2,000th store opened in mid-2020, about eighteen months behind (24, 17). The June 2017 plan promised 2,500 by the end of 2022, and Aldi was still at 2,361 fifteen months after that deadline (25, 18). The 2025 plan promised "more than 225" openings and the year closed at "nearly 200" (26, 2). None of this is a mark against the company. It is a calibration tool. When Aldi says 3,200 by the end of 2028, a developer should model 2028 as the year Aldi reaches somewhere around 3,000 and 2029 or 2030 as the year it reaches 3,200, and should size the pad pipeline accordingly.
Exhibit 2.2: Aldi U.S. Announced Targets Versus Delivery
Plan (date announced) | Target | Outcome | Slippage |
Dec 2013, $3.0 billion | "Nearly 2,000 by 2018" | 2,000 passed mid-2020 | ≈ 18 months |
Jun 2017, $3.4 billion ($5.0 billion with remodels) | 2,500 by end 2022 | 2,361 in March 2024; 2,500 passed mid-2025 | Missed; ≈ 2.5 years |
Feb 2025 | 225+ openings in 2025 | "Nearly 200" | ≈ 11 percent short |
Mar 2024, $9 billion+ | 800 new stores, 3,200 by end 2028 | 2,614 at end 2025; "nearly 2,800" guided for 2026 | Open |
Source: Aldi U.S. releases; Grocery Dive; Supermarket News; CNBC; MMCG database. Slippage is MMCG's calculation from company-stated dates.
The second thing is the Southeastern Grocers transaction, which is widely misread as a banner acquisition and is better understood as a bulk real estate purchase with a fast resale of the parts Aldi did not want. In August 2023 Aldi agreed to buy about 400 Winn-Dixie and Harveys stores in Alabama, Florida, Georgia, Louisiana and Mississippi, roughly 300 of them in Florida; the deal closed on March 7, 2024 (27, 28). Aldi kept about 220 for conversion into its own format and, in February 2025, sold about 170 stores back to a consortium led by C&S Wholesale Grocers and Southeastern Grocers' own management (26, 29). The conversions themselves run at about half a Winn-Dixie: Aldi keeps its 20,000-square-foot format inside the larger shell (30). Conversion guidance has slipped in the same way the opening targets do. Aldi expected about 100 converted stores open by the end of 2025 and reported "nearly 90" in January 2026, while the total has drifted from "approximately 220" to "more than 200" by the end of 2027 (26, 1). Roughly 80 conversions are expected to open in 2026, a large share of them in Florida, which is why Florida is now Aldi's largest state by count, somewhere between 282 and 319 stores depending on which scrape you believe (1, 31).
Lidl's curve has been shaped by subtraction as much as addition. Two Carolina stores closed in 2020 (32). On Sunday, July 16, 2023, Lidl closed about eleven stores in the Carolinas, Virginia, New Jersey, Maryland and Pennsylvania, describing them as "underperforming locations" and declining to confirm the count (33). Its growth since has concentrated in leased urban space in New York City, Washington and Atlanta rather than the suburban pads it started with, and the state distribution reflects the shift: on ScrapeHero's August 2025 snapshot, Virginia and New York were tied at 35 stores each, followed by North Carolina and New Jersey at 26, Maryland at 22, Georgia at 18, Pennsylvania at 13, South Carolina at 11, and Delaware and the District of Columbia at 3 (34). Lidl bought land in Texas and never opened a store there; it marketed 15 North Texas sites totalling more than 83 acres in 2020, and property records show it has been selling down an 18.6-acre San Antonio assemblage it bought in 2017 (35, 36). Neither chain publishes a state-by-state table. That absence is the reason the Aldi state counts circulating online disagree by more than 80 stores, and any per-state figure should be read with its scrape date attached.
3. The Box: What Each Chain Asks a Site to Be
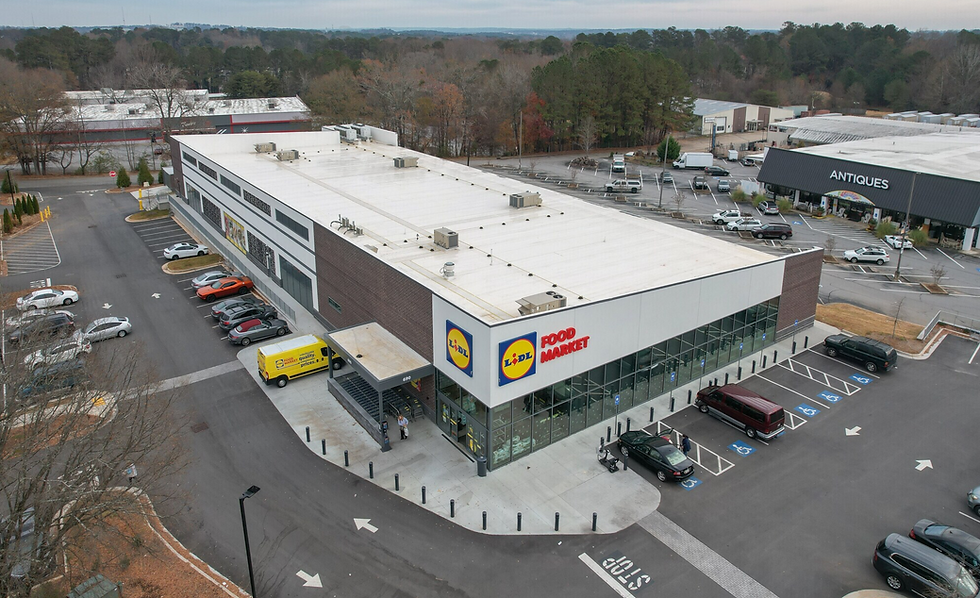
Aldi's published property requirements have barely changed in a decade, and that stability is itself the strategy. The company asks for a store of about 22,000 square feet, a minimum of 95 dedicated parking spaces, a 2.5-acre pad "for purchase and development," or end-cap and inline space with at least 103 feet of frontage, a signalized full-access intersection, traffic of 20,000 or more vehicles per day, "dense trade area population within 3 miles," and a location in a community or regional shopping district that is already zoned for grocery (37). There is no published income threshold. Municipal filings show the delivered building runs a little under the headline: 19,432 square feet with 113 parking spaces in Madison, Alabama; 19,210 square feet on a former car dealership site in Branford, Connecticut (38). The 2017 to 2020 remodel program added about 3,000 square feet, or 20 percent, to the older fleet, which implies a pre-remodel box of 15,000 to 17,000 square feet (24). In other words, Aldi has spent fifty years arriving at one box, and it does not deviate from it even when it buys a 40,000-square-foot Winn-Dixie: it fits its own 20,000 feet inside and leases or sells the rest (30).

Lidl's box has changed three times in nine years, and each change was a retreat. The criteria it published for its 2016 site search asked for a minimum of 3.5 acres for a 36,000-square-foot freestanding store, at least 150 parking spaces, a signalized full-access intersection, 20,000 vehicles per day, dense population within three miles, and a preference for purchasing pads rather than leasing (39). The prototype it actually built was about 36,000 square feet gross with 20,000 square feet of selling space, six aisles and as many as eleven full-size checkout lanes, which the retail consultant Neil Stern described within three months of the launch as "too large, too overly-engineered and too costly to operate" (40, 41). Grocery Dive reported in January 2018 that the U.S. stores were roughly 35 percent larger than Lidl's European format, which averaged around 21,000 square feet, and that from December 2017 the company "began searching for smaller stores between 15,000 and 25,000 square feet" (42). Lidl's own spokesman, Will Harwood, confirmed the shift to Winsight Grocery Business: the new criteria meant a two-mile radius instead of three, 100 parking spaces instead of 150, and shopping centers with co-tenants rather than freestanding pads, and, in his words, would "give our real estate teams the flexibility to dramatically accelerate our expansion" (43). The current Lidl U.S. real estate brochure, undated, asks for a minimum of two acres for a 25,000-to-36,000-square-foot
freestanding store, or 20,000 to 36,000 square feet in a shopping center with "national co-tenants," and lists its deal types as land acquisition, leasing existing space and build-to-suit (44). What Lidl has actually signed in New York City since 2023 sits at the bottom of that range: about 20,700 square feet at Kips Bay on a 15-year lease with three five-year options, about 23,000 in Chelsea, 28,000 at a Federal Realty center in Fresh Meadows, and 25,000 to 33,000 in Brooklyn (45, 46). Its February 2026 opening in Totowa, New Jersey, is 27,245 square feet carved out of a former Marshalls at an Urban Edge center whose other tenants are Staples, Home Depot and Fortunoff Backyard Store (47).
Exhibit 3.1: Published Site Criteria and Delivered Boxes
Specification | Aldi U.S. (current page) | Lidl U.S. (2016 launch) | Lidl U.S. (Dec 2017 revision) | Lidl U.S. (current brochure) |
Building | ± 22,000 sq ft (filed plans 19,200 to 19,400) | 36,000 sq ft | 15,000 to 25,000 sq ft, leased | 25,000 to 36,000 freestanding; 20,000 to 36,000 in-center |
Site | 2.5-acre pad, purchase and develop | Minimum 3.5 acres, purchase preferred | Existing space in shopping centers | Minimum 2 acres |
Parking | Minimum 95 spaces | Minimum 150 (150 to 180 reported) | 100 | 100 to 150 |
Frontage | Minimum 103 ft (inline / end-cap) | n/p | n/p | n/p |
Traffic | 20,000+ vehicles per day | 20,000+ vehicles per day | n/p | 20,000+ vehicles per day |
Trade area | Dense population within 3 miles | Dense population within 3 miles | 2-mile radius | High population density |
Co-tenancy | Community and regional shopping districts | Freestanding or pad | "In shopping centers with co-tenants" | "National co-tenants" |
Income threshold | None published | None published | None published | None published |
Delivered examples | Madison AL 19,432; Branford CT 19,210; Portland ME ≈ 25,000 (former Big Lots) | Roanoke, Wilmington ≈ 29,000 to 36,000 | Aberdeen MD 25,000 (2019) | Kips Bay 20,700; Chelsea 23,000; Totowa 27,245; Fresh Meadows 28,000 |
Source: corporate.aldi.us property requirements page; Lidl U.S. real estate brochure; Supermarket News (2016, 2017); Grocery Dive (January 2018); Commercial Observer; The Real Deal; NJBIZ; municipal planning records (Madison, AL; Branford, CT). "n/p" means not published.
There is a historical rhyme here that the trade press has never quite put together. Aldi's first American store opened in Iowa City in March 1976 inside a converted Giant Food supermarket. It closed at the end of 1977, in part, according to Supermarket News's reconstruction, "because the building was too big to be efficient" (48). Aldi came back to the same town in 1985 in a smaller box and has not built a big one since. Lidl paid for the same lesson forty years later, at a scale of roughly fifty stores, and its corrections since have been variations on the answer Aldi reached in 1977: smaller, leased, in a center, next to other people's traffic.
The lesson generalizes beyond these two companies. A hard discounter's economics depend on a box small enough that three or four people can run it and a site cheap enough that the store can break even on a basket of roughly 1,650 to 3,250 items at margins that would embarrass a conventional supermarket. Every extra 10,000 square feet of building, every extra acre of asphalt and every checkout lane that stands idle is a fixed cost the model was designed to avoid. Lidl's 2016 criteria were a conventional supermarket's criteria wearing a discounter's logo, and the outcome followed from the criteria more than from the merchandising.
4. Tenure and Capital: Who Owns the Dirt, and What It Cost
Neither chain publishes a split between owned and leased stores, and no U.S. sale-leaseback by either has ever been disclosed. What the public record does show is a pattern, and the pattern runs in opposite directions.
Aldi buys and develops. Its requirements page says "2.5 acre pads for purchase and development," and its real estate team runs an active disposals program for former stores, surplus outparcels and adjacent tenant space (37, 49). Press reports citing county records show it selling a 1.5-acre outparcel in Cheektowaga, New York, that it had owned since 1997 to a Taco Bell developer for $675,000, and a former Milwaukee store for about $1 million (50). It bought three former Big Lots stores out of the Chapter 11 estate in 2025 and, by one retail real estate analyst's count, has backfilled parts of more than 40 former Kmarts and a dozen former Toys R Us boxes over the years (51, 52). It leases selectively where the arithmetic favors it, most visibly as a tenant in REIT-owned centers: a former Big Lots at Brixmor's Pine Tree Shopping Center in Portland, Maine, for its first Maine store, and the Aldi-anchored Springs Plaza in Bonita Springs that Cohen & Steers' income REIT acquired alongside Phillips Edison in December 2025 at 99 percent occupancy (53, 54). SEC filings in the CMBS market show the third mode, the ground lease: at Steelyard Commons in Cleveland, Aldi signed a 15-year ground lease on a 15,808-square-foot pad in November 2012 and built the store largely at its own cost (55). Fee ownership where it can, ground leases where it must, backfills where the box is cheap. It is a landowner's playbook run by a grocer.
Lidl started as a landowner and became a tenant. It built and "in many cases" owned its first 47 sites, then announced in December 2017 that it was "now interested in leasing sites as opposed to solely purchasing them" (20, 43). Its first leased store was at the Staten Island Mall in 2018, its 27 Best Market stores came with leases rather than deeds, and its New York City program since 2023 is entirely lease-driven (56, 57, 45). Meanwhile it has been liquidating the land it bought in 2016 to 2018 and never built on, in Texas, western Virginia and elsewhere (35, 36, 58). Lidl still describes itself as "an institutional owner and developer of real estate" and lists surplus properties for sale (59), but its only investment sales of stores have been in Europe: twelve UK stores to Roadside Retail for £70 million on 25-year leases in October 2024, and 24 new stores in the UK, Ireland and Spain to ICG Real Estate for €203.5 million in November 2025, all on long-term triple-net leases (60, 61). The majority of Lidl GB's estate is freehold, according to trade press; the U.S. estate, on every documented indicator, is now majority leased (60).
Capital committed tells the same story from the other side. Aldi has published four programs: $3 billion in 2013 to reach 2,000 stores, $1.6 billion in February 2017 to remodel 1,300 stores, $3.4 billion in June 2017 to reach 2,500 stores ($5 billion combined), and more than $9 billion in March 2024 for 800 stores, supply chain and digital through 2028 (24, 25, 28). Lidl's disclosed U.S. spend is $202 million for its Arlington headquarters and Spotsylvania distribution center in 2015, $100 million for a Cartersville, Georgia distribution center in 2017, and "more than $500 million" for 50 stores announced in August 2020 (22, 62, 32). Virginia's economic development agency puts Lidl's cumulative investment in that state alone at $353 million (22). Neither company states a cost per store. The 2020 Lidl figure implies about $10 million per store all-in; the Aldi 2024 figure implies about $11 million, but that total explicitly includes distribution centers and conversions, so the two are not like for like. Building permits, which cover vertical construction only, valued individual Lidl stores at $2.1 million in Roanoke County in 2017 and $3.3 million in Wilmington in 2019, and Lidl's Deer Park, New York flagship at more than $15 million (63, 64).
Exhibit 4.1: Announced U.S. Capital Programs and Implied Cost per Store
Program | Announced | Capital | Stores | Implied per store | Caveat |
Aldi 2013 to 2018 | Dec 2013 | $3.0 billion | ≈ 650 | ≈ $4.6 million | Includes remodels, DCs |
Aldi remodel | Feb 2017 | $1.6 billion | 1,300 remodels | ≈ $1.2 million | Remodel only |
Aldi 2017 to 2022 | Jun 2017 | $3.4 billion | ≈ 800 to 900 | ≈ $4 million | Stated with remodels as $5 billion |
Aldi 2024 to 2028 | Mar 2024 | $9 billion+ | 800 | ≈ $11 million | Includes 3 DCs, digital, conversions |
Lidl Virginia set-up | Jun 2015 | $202 million | HQ and DC | n/a | Pre-store infrastructure |
Lidl Georgia DC | 2017 | $100 million | DC | n/a | Pre-store infrastructure |
Lidl 2020 to 2021 | Aug 2020 | $500 million+ | 50 | ≈ $10 million | Only Lidl program with a store count |
Schwarz Group, all markets | Jun 2026 | ≈ €9 billion (FY2025); €10 billion+ planned | +300 net | n/m | Includes digital, recycling, Kaufland |
Source: Aldi U.S. releases; Lidl U.S. releases; VEDP; Grocery Dive; Schwarz Group; MMCG database. Per-store figures are MMCG calculations from company totals and are not company disclosures.
The reason this matters to a lender is not the absolute number. It is that Aldi has consistently funded stores out of a mature, cash-generating U.S. operation and a pipeline of owned land, while Lidl front-loaded roughly $300 million of infrastructure and an undisclosed amount of land before it had a single store producing sales, then had to carry that infrastructure through a decade in which the store count never reached the level the distribution network was sized for. That is the same sequence Tesco followed with Fresh & Easy, and we return to it in Section 6.
5. Financial Performance: What the Audited Numbers Actually Say
Anyone quoting a U.S. margin for Aldi or Lidl is guessing. The only audited accounts either chain files anywhere are the statutory accounts of their UK subsidiaries at Companies House, and those are the numbers this section leans on, with the U.S. estimates set against SEC-filed benchmarks afterwards (65).
Aldi Stores Limited, which covers the UK and Ireland, reported sales of £18.1 billion for the year to December 31, 2024, up from £17.9 billion, and operating profit of £435.5 million, down from £552.9 million, a margin of 2.4 percent against 3.1 percent the year before (66). Its chief executive told The Grocer that like-for-like sales were down in 2024, with growth coming from new space, and the company simultaneously announced £1.6 billion of investment for 80 new stores across 2026 and 2027, which is up to £20 million per store if the whole sum went to stores, which it will not (66, 67). Lidl Great Britain Limited reported turnover of £11.7 billion for the year to February 28, 2025, up 7.9 percent, and operating profit of £314.1 million, a 2.7 percent margin, on only twelve new stores; the year before, it made £220.8 million on £10.9 billion, and the year before that £28.5 million on £9.3 billion, a margin of 0.3 percent, with a pre-tax loss of £76 million (68, 69). Two things stand out. The two chains earn essentially the same margin, and both let it swing by two full points from year to year as they buy price position. And Aldi takes far more revenue through each box: roughly £17.4 million per store on about 1,040 stores, against roughly £12 million per store for Lidl on 960 to 980 stores, a gap of about 45 percent (66, 68; MMCG computation).
Exhibit 5.1: The Audited Benchmark, Aldi UK and Ireland vs. Lidl GB
Metric | Aldi Stores Ltd (FY Dec 2024) | Lidl Great Britain Ltd (FY Feb 2025) |
Revenue | £18.1 billion (+1.1%) | £11.7 billion (+7.9%) |
Operating profit | £435.5 million | £314.1 million |
Operating margin | 2.4% (2023: 3.1%; 2022: 1.2%) | 2.7% (FY24: 2.0%; FY23: 0.3%; FY22: 1.0%) |
Stores (approx.) | ≈ 1,040 UK | ≈ 960 to 980 GB |
Revenue per store | ≈ £17.4 million (≈ $23.6 million) | ≈ £12.0 million (≈ $16.3 million) |
Average employees | 50,660 | 35,000+ (boilerplate, not audited average) |
Revenue per employee | ≈ £358,000 | ≤ £334,000 |
Like-for-like sales | Negative (CEO statement) | Positive (12 openings, +7.9% revenue) |
Announced capex | £1.6 billion, 80 stores, 2026 to 2027 | "Around half a billion" in FY25; 40 openings planned FY26 |
Entry hourly pay (Sept 2025) | £13.02 national, £14.35 inside M25 | £13.00 national, £14.35 London |
Source: Aldi UK press release (September 15, 2025); Lidl GB press releases (October 22, 2025; November 20, 2024); Companies House filing histories (02321869, 02816429); The Grocer; Lidl GB pay release (August 2025); MMCG computations. Per-store and per-employee figures are MMCG calculations; GBP to USD at 1.356.
Now the U.S., with the caveats attached. Taking Kantar's $58.36 billion, removing Trader Joe's, and dividing by about 2,400 stores gives Aldi U.S. revenue of $13.9 million to $15.4 million per store in 2025, and, on an assumed 20,000-square-foot box, roughly $700 to $770 per square foot (12, 13; MMCG computation). That is well above the roughly $520 per square foot of the average U.S. supermarket (MMCG database) and about the same as Sprouts, which reported $8.8 billion across 477 stores in its 2025 10-K, or $18.5 million per store on new boxes of 21,000 to 25,000 square feet (70). The Aldi figure is not audited and should not be quoted without the word "estimate." Kantar's own calibration is uneven: its Sprouts estimate matches the 10-K within 0.05 percent, but its Kroger estimate is $7.1 billion, or 4.8 percent, above the $147.6 billion Kroger actually reported (12, 71). For a company that does not report at all, the error band is unknowable.
Exhibit 5.2: U.S. Benchmarks From SEC Filings, Latest Fiscal Year
Metric | Aldi U.S. (est.) | Lidl U.S. (est.) | Kroger (FY Jan 2026) | Sprouts (FY Dec 2025) |
Revenue | $33 to $37 billion | < $4.06 billion | $147.6 billion | $8.8 billion |
Stores | ≈ 2,400 avg. 2025; 2,614 year end | ≈ 200 | ≈ 2,700 | 477 |
Revenue per store | $13.9 to $15.4 million | n/d | ≈ $55 million | $18.5 million |
Box | ≈ 20,000 sq ft | 20,000 to 36,000 sq ft | ≈ 60,000+ sq ft | 21,000 to 25,000 sq ft (new stores) |
Gross margin | n/d | n/d | 22.9% | 38.8% |
Operating margin | n/d (UK: 2.4%) | n/d (GB: 2.7%) | 1.3% GAAP; 3.3% adjusted | n/d here |
OG&A / SG&A as % of sales | n/d | n/d | 19.2% (17.3% prior year) | n/d here |
Rent as % of sales | n/d | n/d | 0.6% | n/d here |
Staff per store | ≈ 20 (all roles, 49,000 / 2,400) | 50 to 60 at 2017 launch | ≈ 150 (400,000 / 2,700) | 75 to 100 |
Starting store wage | $18 average (Sept 2024) | $15 (2021 markets) | n/d | n/d |
Private label share | ≈ 90% "ALDI-exclusive" | ≈ 80% (down from ≈ 90% at launch) | n/d | n/d |
SKUs | ≈ 1,650 to 1,800 (third-party) | 3,250 (cut from 4,500) | 30,000+ | n/d |
Source: NRF/Kantar Top 100 Retailers 2026; Kroger Q4 FY2025 earnings release (March 5, 2026); Sprouts Farmers Market Form 10-K FY2025; Grocery Dive; Supermarket News; Aldi careers site; MMCG database. Aldi and Lidl U.S. figures are estimates or computations, not disclosures.
The cost side is where the format earns its keep, and it can be read off the benchmarks even without a discounter's own figures. Kroger spent 19.2 percent of sales on operating, general and administrative costs in fiscal 2025, 17.3 percent in a clean prior year, on a 22.9 percent gross margin, and paid 0.6 percent of sales in rent (71). The German trade press puts Aldi Süd's trading margin in its home market at about 23 percent, essentially the same as Kroger's gross margin (72). If the two chains earn the same gross margin and end up at a similar 2 to 3 percent operating margin, the discounter is not winning on margin at all. It is passing a lower cost base through to the shelf price. Two documented costs explain most of that base. Aldi U.S. employs about 49,000 people across just under 2,400 stores, or about 20 per store including warehouse and head office staff, at an average starting store wage of $18 an hour; Sprouts runs 75 to 100 people per store and Kroger more than 400,000 across its estate (73, 70, 71). And the box is a third the size of a conventional supermarket on a site a third the size, with the occupancy cost that implies. Neither chain is cheap because it pays badly. In the UK the two are locked at £13.02 and £13.00 an hour, both about 6.5 percent above the statutory floor (66, 74). They are cheap because twenty people and 20,000 feet can move $15 million of groceries a year.
One estimate that circulates should be retired. Dividing the Kantar-derived Aldi U.S. revenue by the 49,000 associates gives $680,000 to $750,000 of sales per employee, 40 to 55 percent above the £358,000 (about $485,000) that Aldi's audited UK accounts show for the same operating model (66, 73). Either the U.S. sales estimate is high or the headcount is low. Until one of them is confirmed, the ratio is evidence that the U.S. estimates do not reconcile, not a finding about productivity.
6. The Lidl U.S. Post-Mortem: A Real Estate Problem Before It Was Anything Else
The story of Lidl in America is usually told as a merchandising story: too much organic produce for the Carolinas, not enough prepared food, a private-label range that shoppers did not recognize. All of that is documented and some of it is true. But the sequence of events in the public record says the first and most expensive mistake was made by the real estate department, and that the rest followed.
Lidl set up its U.S. headquarters in Arlington, Virginia in June 2015 with a $202 million commitment to the state, $77 million for the head office and $125 million for a regional headquarters and distribution center in Spotsylvania, and followed with regional centers in Alamance County, North Carolina and Cecil County, Maryland, and a $100 million center in Cartersville, Georgia (22, 75, 62). On May 17, 2017 it announced 20 stores for the summer and "up to 100" by the summer of 2018 (75). The first nine opened on June 15, 2017 in Virginia and the Carolinas (19). By September the retail consultancy McMillanDoolittle was on record that the stores were overbuilt; by August, WSJ-reported inMarket data showed Lidl's share of grocery visits in its nine launch markets had fallen from 11 percent in June to below 8 percent (41, 84). By December the company had 47 stores, had quietly rewritten its site criteria, and was leasing rather than buying (20, 43). In January 2018, Klaus Gehrig, then chief executive of the Schwarz Group, told Manager Magazin that the U.S. stores were too big, too expensive and often badly located, that the company had misjudged American demand for prepared food, and that it now expected about 20 openings in 2018, which Grocery Dive noted was "less than half of the 49 openings over the past seven months" (42, 85). "If you recognize a mistake," Gehrig said, "you have to correct it."
Correcting it has taken nine years and six chief executives. Brendan Proctor, who ran the launch, was replaced in 2018 by Johannes Fieber from Lidl Sweden; Fieber by Michal Lagunionek from Lidl Poland in 2021; Lagunionek by Joel Rampoldt, a turnaround consultant from AlixPartners, in September 2023; Rampoldt by an interim, Marco Giudici from Lidl Romania, in January 2026; and Giudici by Alan Barry, the company's U.S. chief operating officer and a veteran of Lidl Ireland and Great Britain, from July 2026 (76, 77, 78, 79, 4). Along the way Lidl bought Best Market's 27 Long Island and New York City stores in November 2018, announced a $500 million, 50-store program in 2020, cut about 200 corporate jobs in February 2023, closed eleven stores that July, relaunched its U.S. brand in October 2024, and under Rampoldt cut the average assortment from 4,500 to 3,250 items with about 80 percent private label, down from about 90 percent at launch (21, 32, 79, 33, 80). The geography narrowed at the same time, from the whole East Coast to three metros: New York, Washington and Atlanta (81). The landlord community has noticed. A RetailStat analyst told Grocery Dive in January 2026 that he was not sure Lidl was a tenant he "would want to put on a 20-year lease" (79). For a chain trying to grow through leased urban space, that sentence is the whole problem in one line.
Exhibit 6.1: Lidl U.S. Timeline, 2015 to 2026
Date | Event | Stores |
Jun 2015 | Arlington HQ; $202 million Virginia commitment; Brendan Proctor CEO | 0 |
May 17, 2017 | Launch announced: 20 stores by summer, "up to 100" by summer 2018 | 0 |
Jun 15, 2017 | First nine stores open in VA, NC, SC; 36,000 sq ft prototype | 9 |
Dec 2017 | Site criteria revised: 15,000 to 25,000 sq ft, leased, in centers | 47 |
Jan 2018 | Schwarz CEO Gehrig: stores too big, too expensive, poorly located; 2018 target cut to ≈ 20 | ≈ 48 |
2018 | Johannes Fieber replaces Proctor; first leased store (Staten Island Mall) | 59 (Nov) |
Nov 2018 | Best Market acquisition, 27 stores, terms undisclosed | 59 + 27 |
2019 | First 25,000 sq ft store (Aberdeen, MD); six Shoppers stores bought | n/d |
Aug 2020 | $500 million, 50-store plan; two NC stores closed | 100+ |
Jun 2021 | Michal Lagunionek CEO | ≈ 150 |
Oct 2022 | Virginia agency counts 170+ | 170+ |
Feb to Jul 2023 | ≈ 200 corporate layoffs; 11 stores closed July 16 | ≈ 170 |
Sep 2023 | Joel Rampoldt CEO; SKU cut to 3,250 follows | ≈ 170 |
Oct 2024 | U.S. brand relaunch; growth refocused on NYC, DC, Atlanta | ≈ 175 |
Jan 2026 | Rampoldt out; Marco Giudici interim | ≈ 190 |
Jul 2026 | Alan Barry CEO; 200th store (Brooklyn) | "more than 200" |
Source: Lidl U.S. press releases; VEDP; Grocery Dive; Supermarket News; Store Brands; Chain Store Age; Forbes; Discount Retail Consulting; MMCG database. Store counts are as reported at each date and are not reconciled across sources.
The comparison case is Tesco. Fresh & Easy opened its first Southern California stores in November 2007 with a purpose-built distribution campus in Riverside, reached 199 stores, and was put up for sale in April 2013 after absorbing more than £1 billion of capital; Tesco booked a £1.2 billion hit, made up of a £1 billion exit charge and £169 million of trading losses, and told shareholders that much of the write-down was "due to fixed assets and onerous leases" (82). The stores went to Yucaipa in November 2013 with an £80 million loan from Tesco attached, and closed for good in October 2015 (83). The two cases share one axis: both entrants built the distribution network, the head office and a large owned property base before the stores had proved they could earn their keep, and both then discovered that the format they had built was the wrong size for the market. Tesco sold. Lidl, with a parent generating €185 billion a year and no shareholders to answer to, absorbed the cost and kept going. That difference in ownership is the only reason Lidl U.S. still exists, and it is worth remembering when a landlord is asked to accept the Lidl covenant on a 15-year lease: the parent's willingness to carry losses is real, but it is a policy, not a guarantee.
7. What a Discounter Does to a Trade Area: The Evidence, Sorted by Who Paid for It
The most quoted numbers about Aldi and Lidl's effect on their neighbors are also the least independent. In 2018, Katrijn Gielens of UNC Kenan-Flagler compared six markets where Lidl had opened against six matched markets without Lidl, using a 48-item basket priced by store visits in October 2017, and found that Aldi, Food Lion, Kroger, Publix and Walmart stores near a Lidl priced the basket 9.3 percent lower on average, and up to 55 percent lower on staples such as milk (86). A 2020 follow-up on Long Island found that after Lidl opened its converted Best Market stores, Aldi cut prices 15 percent, Walmart 9 percent, Costco 8.3 percent and Stop & Shop 5.3 percent, while ShopRite, the market's price leader, was excluded for data-collection reasons (87). Both studies were commissioned and paid for by Lidl U.S., which UNC disclosed in every release and which the trade press repeated. The direction is almost certainly right. The magnitudes are upper bounds from a funded design without a peer-reviewed control, and should be cited with the funder in the same sentence.
The independent evidence is European, older, and more modest. Vroegrijk, Gijsbrechts and Campo studied 194 hard-discounter openings in the Netherlands with household panel data and found incumbent chains lost 4.4 to 14.3 percent of their customer share, 9.3 percent on average, and 9.2 percent of average spending, but that the losses came from shoppers who were already splitting trips across chains, not from the incumbent's best customers (88). Cleeren, Verboven, Dekimpe and Gielens modelled German local markets, where the discount format had already matured, and found that discounters only start to damage conventional supermarkets' profitability from the third discount entrant onwards; one or two can coexist with a supermarket without hurting it (89). Australia's competition regulator concluded in 2008 that Aldi had forced Coles and Woolworths to cut prices specifically in the localities where Aldi traded, and in its 2025 supermarkets inquiry it still described Aldi, at 9 percent national share, as a crucial lower-priced alternative while noting that Aldi had raised prices faster than the big two between 2022 and 2024 (90, 91). And the geography of the effect is tight. Ellickson and Grieco's store-level census of U.S. supermarkets found that a Walmart's impact reaches only firms within about two miles; Arcidiacono and co-authors put incumbent revenue losses from supercenter entry at about 12 percent at one mile, 5 percent at three to five miles, and nothing beyond five (92, 93). Those are Walmart numbers, not discounter numbers, but they are the right yardstick for any trade-area analysis, and they are why MMCG uses a two-mile ring, not a ZIP code, when it measures a discounter's neighborhood.
Exhibit 7.1: The Evidence Base on Discounter Entry, by Type and Funder
Question | Study | Design and sample | Finding | Type |
Price effect | Gielens, UNC (2018) | 6 Lidl vs. 6 control markets, 48 items, Oct 2017 | Incumbents 9.3% lower on average, up to 55% on staples | Working paper, funded by Lidl U.S. |
Price effect | Gielens, UNC (2020) | 27 Long Island stores, before and after | Aldi cut 15%, Walmart 9%, Costco 8.3% | Working paper, funded by Lidl U.S.; price leader excluded |
Price effect | ACCC (2008, 2025) | Regulator inquiries | Aldi forced Coles and Woolworths to cut prices where present | Regulator finding |
Incumbent share | Vroegrijk et al. (2013), JMR | 194 Dutch openings, household panel | Customer share loss 4.4% to 14.3%, avg. 9.3%; from multi-store shoppers | Peer-reviewed, public funder |
Incumbent profit | Cleeren et al. (2010), Marketing Science | German local market entry model | Supermarket profits fall only from the third discount entrant | Peer-reviewed |
Radius | Ellickson and Grieco (2013), JUE | U.S. supermarket census 1994 to 2006 | Walmart impact confined to ≈ 2 miles | Peer-reviewed |
Radius | Arcidiacono et al. (2020), AEJ Applied | Supercenter entry | 12% loss at 1 mile, 5% at 3 to 5 miles, nil beyond 5 | Peer-reviewed |
Independents | Cakir et al. (2020), AJAE | NETS data, rural markets 1990 to 2015 | Large-chain entry linked to independent exit; ≈ 6.6% annual exit rate | Peer-reviewed |
Independents | USDA ERS (2024) | Dollar-store entry, 2000 to 2019 | Independent closure odds +5% rural, +1.7% urban | Federal, peer-reviewed |
Home values | Pope and Pope (2015), JUE | 1M+ sales near 159 Walmarts | +2% to 3% within 0.5 mile | Peer-reviewed, no funder |
Home values | Wang (2023), RSUE | Walmart openings 1990 to 2013 | Premium fell from ≈ +3% (1990s) to ≈ minus 3% (2008 to 2013) | Peer-reviewed |
Home values | ATTOM (2022) | ZIP-code averages, no controls | Aldi ZIPs +58% vs. Trader Joe's +49%, Whole Foods +45% | Vendor study |
Anchor rent | Pashigian and Gould (1998), JLE | U.S. malls | Anchors pay at most 28% of non-anchor rent per sq ft | Peer-reviewed; malls, not grocery |
Source: UNC Kenan-Flagler; Journal of Marketing Research; Marketing Science; ACCC; Journal of Urban Economics; AEJ: Applied Economics; American Journal of Agricultural Economics; USDA ERS; Regional Science and Urban Economics; ATTOM Data Solutions; Journal of Law and Economics. Compiled by MMCG.
On real estate specifically, the honest summary is that the discounter effect is unmeasured. The causal, peer-reviewed home-value work concerns Walmart and Whole Foods. Pope and Pope found a new Walmart raised house prices 2 to 3 percent within half a mile in the 2000s; Wang's 2023 re-estimation found that premium had been about 3 percent for 1990s openings, about zero for 2002 to 2007 openings, and about minus 3 percent for 2008 to 2013 openings, which is a warning that an amenity premium is not a law of nature (96, 97). The ATTOM "Grocery Store Wars" figures that get repeated every year, most recently that homes in ZIP codes with an Aldi appreciated 58 percent over five years against 49 percent near Trader Joe's and 45 percent near Whole Foods, are ZIP-code averages with no pre-period and no controls, and the average home value in those Aldi ZIPs was $321,116 against $987,923 near Trader Joe's (98). That is not a store raising values. It is a chain choosing cheaper neighborhoods, which then appreciate faster off a lower base, as cheaper neighborhoods did everywhere between 2017 and 2022. ATTOM's own spokesman called the causality "a little bit of a chicken-and-egg scenario," which is more candor than most of the pages citing him show. The claim that an Aldi or a Lidl raises nearby home values has no traceable causal study behind it, and MMCG does not use it in a feasibility file. What can be said is narrower and more useful: within two miles, an incumbent grocer should be modelled to lose a mid-single-digit to low-double-digit share of spending from its multi-store shoppers, its prices will move, and its lease covenant should be underwritten on the post-entry number.
8. Lending and Net-Lease Implications
For a lender or a net-lease buyer, the two chains present very different credit questions, and the SEC record, thin as it is, helps frame both.
Neither Aldi nor Lidl carries a public rating, so neither is an investment-grade tenant in the formal sense that a REIT's top-tenant schedule recognizes. Agree Realty's fiscal 2025 10-K lists every tenant at 1.5 percent or more of annualized base rent, Walmart at 5.6 percent and Kroger at 2.9 percent among them; neither Aldi nor Lidl appears, which means each is either below 1.5 percent of Agree's $733 million of base rent or absent (103). The lease terms that are documented in SEC filings are consistent with Aldi behaving like an owner even when it is a tenant. The Steelyard Commons ground lease in Cleveland runs fifteen years on a 15,808-square-foot pad, with the building constructed by Aldi largely at its own cost (55). An Inland Diversified 8-K discloses an Aldi paying $214,212 of annual base rent under a lease expiring in 2025 with five five-year renewal options to 2050, in a center shadow-anchored by a Walmart Supercenter (104). A 15-year initial term with five options and the tenant's own capital in the building is an owner-occupier's structure, and it is why Aldi ground leases are treated by the net-lease market as long-duration, low-management paper regardless of the missing rating. The cap rates quoted for that paper, typically in the mid-5 to low-6 percent range in the first quarter of 2026, come from brokerage and listing sources, not from any filing, and MMCG records them as reported, not documented.
Lidl is the harder credit, for reasons Section 6 sets out. The lease terms are similar on paper, fifteen years with three five-year options in the Kips Bay deal (45), but the operating history includes two closure waves, six chief executives, a corporate layoff and a public reset, and the only sale-leaseback investors who have priced Lidl paper have done so in Europe, where the tenant's market share is 8 to 15 percent rather than a rounding error. A lender underwriting a Lidl-anchored center should apply the same discipline it would to any unrated regional grocer with a foreign parent: the parent's willingness to fund losses is real and documented, and it is not a guarantee unless the lease says so.
Exhibit 8.1: Documented Lease Terms and Credit Facts, From Public Filings Only
Item | Aldi | Lidl |
Public rating (Moody's, S&P, Fitch) | None | None |
Named in REIT top-tenant tables (Agree, FY2025) | No (< 1.5% of ABR or absent) | No |
Documented ground-lease term | 15 years, building built by tenant at own cost (Steelyard Commons, 2012, CMBS) | 15 years with three 5-year options (Kips Bay, 2025, trade press) |
Documented renewal options | Five 5-year options to 2050 (Inland Diversified 8-K) | Three 5-year options (NYC) |
Documented U.S. sale-leaseback | None found | None found |
Documented European sale-leaseback | None found | 12 UK stores, £70M, 25-year leases (2024); 24 stores UK/IE/ES, €203.5M, long-term NNN (2025) |
Parent capital-markets activity | None reported | ≈ $1.8 billion private placement (2024, reported, unnamed sources) |
Tenant entity | Regional operating entities (e.g. ALDI (Florida) LLC) | Lidl US, LLC, wholly owned by Lidl Stiftung & Co. KG |
Source: Agree Realty Form 10-K FY2025; JPMBB 2013-C12 offering documents (SEC); Inland Diversified Real Estate Trust Form 8-K (2010); Commercial Observer; ICG Real Estate; Retail Gazette; Bloomberg Law; Kovalev v. Lidl US, LLC; MMCG database. Cap rates are excluded because none is disclosed in a filing.
[EMBLEM 6 · Aldi vs. Lidl · The lender's view · Views: (a) documented lease structure, Aldi vs. Lidl, (b) what an SBA borrower near a discounter should model within 2 miles, (c) the NAICS 445110 loss-rate method. Source line: SEC filings as listed in Exhibit 8.1; SBA 7(a) and 504 FOIA data as of March 31, 2026; MMCG database.]
The SBA's 7(a) and 504 FOIA files on data.sba.gov carry, for every loan since 1991, the NAICS code, the loan status, the charge-off date and the gross charge-off amount, updated quarterly, most recently as of March 31, 2026 (105). No federal agency, no GAO or CRS report and no peer-reviewed paper has ever published a default or charge-off rate for NAICS 445110, supermarkets and other grocery stores, which is the code under which both Aldi and Lidl, and every independent grocer they compete with, are classified. The only figure in circulation is a commercial one, PeerSense's 16.2 percent default rate for the broader three-digit NAICS 445, against 15.8 percent for all industries and 18.9 percent for franchised food stores, and it is a vendor estimate at the wrong level of aggregation (107). The file supports a 445110 series by approval-year cohort, with independents split from franchises by the FranchiseCode field and project county joined to the discounter opening dates in Section 2, so that grocer loan performance can be read before and after a discounter arrives within two miles. One technical warning for anyone building it: the March 2026 release reportedly split the old CHGOFF status into CHGOFF, CLSLN and SOLDCO, so a series that counts CHGOFF alone will understate losses by roughly a third from that vintage forward (106).
What a lender should take from all of this is practical. An SBA 7(a) or 504 borrower on an outparcel next to an Aldi is next to a tenant that is, in every documented respect except the rating, a fee owner or a 15-year ground lessee with its own capital in the building, whose 2,614-store estate has never had a publicly reported closure wave. The same borrower next to a Lidl is next to a tenant with a documented history of closing underperforming stores in bulk and a landlord community that has said so on the record. The feasibility study should say which, and should model the trade area on the post-entry incumbent figures in Section 7 rather than on the pre-entry rent roll.
9. Strategic Outlook 2026 to 2030, With Europe as the End State
The useful thing about a mature market is that it tells you where the immature one is going. In Germany, Lidl operates more than 3,250 stores and the two Aldis about 4,200 between them, in a country of 83 million people; that is roughly 39 Lidls and 50 Aldis per million residents (8, 9, 113). In Great Britain, both chains passed 1,000 stores in 2023 and 2025 respectively, or about 15 per million, and between them hold 19.4 percent of the grocery market on Worldpanel's May 2026 reading, Aldi at 10.8 and Lidl at 8.6 (108, 112). In Ireland, Lidl leads Aldi, 15.0 to 11 percent (109). In the United States, Aldi's 2,614 stores work out to about 7.7 per million, half the UK density and a sixth of Germany's, and Lidl's 200 to about 0.6 per million nationally, or perhaps 2 per million inside the nine states it actually serves (MMCG computation). Nobody should extrapolate German density to America, where the incumbents are cheaper and the car is universal. But the UK, which had a strong incumbent set and a car-based suburban geography when the discounters arrived in the 1990s, is a fair ceiling, and on that ceiling the U.S. hard-discount estate could roughly double before it looks saturated.
Exhibit 9.1: Store Density Benchmark, Stores per Million Residents
Market | Aldi | Lidl | Combined share of grocery | Note |
Germany | ≈ 4,200 (Nord ≈ 2,200 + Süd ≈ 2,000); ≈ 50 per million | 3,250+; ≈ 39 per million | Aldi ≈ 14% (trade ranking); Lidl n/d | Home market of both |
Great Britain | 1,000+ (Sept 2023); ≈ 15 per million | 1,000+ (late 2025); ≈ 15 per million | 19.4% (Worldpanel, 12 weeks to May 17, 2026) | CMA reclassified both as "Large Grocery Retailers," Aug 2026 |
Ireland | n/d | n/d | Lidl 15.0%, Aldi 11% (Worldpanel, June 2026) | Only market where Lidl leads Aldi |
United States | 2,614; ≈ 7.7 per million | ≈ 200; ≈ 0.6 per million | Aldi ≈ 5.7% of grocery visits (Placer.ai, Q1 2025) | Aldi target 3,200 by end 2028 |
Source: Schwarz Group FY2025; Handelsblatt; Aldi Süd; Worldpanel by Numerator via The Grocer and RTE; Placer.ai; CMA; Aldi U.S.; Lidl U.S.; population denominators are round Census, ONS and Destatis figures; MMCG database.
Europe also shows what the end state of the real estate looks like, and it is not benign for landlords. Lidl GB publishes a twice-yearly site requirements brochure listing, town by town, where it wants 18,000-to-26,500-square-foot stores on 1.5-plus acres, with a finder's fee for anyone who brings one (110). Savills told The Grocer in 2026 that UK retail parks are "effectively full" after the discounters' expansion (111). And on August 7, 2026 the UK Competition and Markets Authority provisionally decided that Aldi, Lidl GB and Lidl NI are now "Large Grocery Retailers" under the 2010 Controlled Land Order, which means they can no longer use restrictive covenants to block rival supermarkets from opening near their stores, a status previously applied only to the established supermarket chains (100). That is the arc: from limited-assortment discounter that regulators in 2008 said was not a close substitute for a supermarket, to a combined market share approaching 20 percent, to being regulated as an incumbent. The U.S. is a long way from any of that, and the absence of a covenant rule means there is nothing to stop either chain from tying up pads. But the trajectory is the one American developers should plan against.
Exhibit 9.2: Likely Leader by Dimension, 2026 to 2030
Dimension | Likely leader | Rationale |
Store growth, absolute | Aldi | 180+ openings per year against Lidl's 10 to 20; 800-store program funded |
Store growth, per capita ceiling | Aldi | UK density implies room to roughly double the U.S. estate |
Box discipline | Aldi | One 20,000 sq ft format for fifty years; Lidl on its third |
Revenue per store | Aldi | ≈ 45% higher in the audited UK accounts; U.S. estimates consistent |
Urban infill and leased small format | Lidl | NYC, DC and Atlanta program is the only documented U.S. growth Lidl has |
Landlord confidence | Aldi | No reported closure wave; owner-style lease terms; Lidl's covenant questioned on record |
Site supply risk | Aldi (as risk-bearer) | 3,200 by 2028 needs 600 qualifying pads in three years; targets historically slip 1 to 2 years |
Price pressure on incumbents | Both | Effect is local (≈ 2 miles) and independent of which chain; Lidl's is better documented, by Lidl |
Credit for net-lease buyers | Aldi | Unrated, but owner-occupier structure and fifty-year U.S. record |
Turnaround optionality | Lidl | A €185 billion parent that has shown it will fund losses; new CEO from the successful UK and Ireland operation |
Source: MMCG database; company releases; sources as cited throughout.
Three things will decide whether the gap narrows by 2030. The first is whether Aldi can find 600 pads that meet its criteria in three years while entering Colorado, Phoenix and Las Vegas, where its criteria have never been tested at scale; its history says it will find them a year or two late. The second is whether Alan Barry, who ran stores in the one Anglophone market where Lidl beats Aldi, can turn the New York and Washington leases into a format that a landlord will underwrite for twenty years. The third is capital: Aldi will spend more than $9 billion on the U.S. by 2028 and Lidl has not put a U.S. number in public since 2020. Our base case is that Aldi reaches 3,000 stores in 2028 and 3,200 in 2029 or 2030, that Lidl reaches 250 to 275 stores by 2030 concentrated in three metros, and that the ratio between them stays above 10 to 1 for the rest of the decade. The measured version of that comparison, parcel by parcel, is the next thing MMCG will publish.
Working with MMCG on Discount Grocery Real Estate
MMCG Invest, LLC is a national commercial real estate feasibility consulting firm with direct experience of grocery-anchored and discounter-adjacent retail, outparcel underwriting, and SBA 7(a) and 504 feasibility deliverables for borrowers whose trade area includes an Aldi or a Lidl. The firm holds Appraisal Institute Practicing Affiliate status and has produced third-party feasibility studies for SBA, USDA Business and Industry, and conventional lenders across hospitality, multifamily, retail, industrial, gas station and specialty-use asset classes. The parcel, footprint and trade-area measurements behind this analysis are produced on the MMCG Analytics platform. For developers, investors or lenders evaluating an Aldi- or Lidl-anchored project, a pad or outparcel adjacent to either, or an independent grocer's exposure to a discounter opening nearby, reach out to discuss study scope, timeline and pricing. Readers interested in how the incumbents are responding will find our earlier essay on Kroger a useful companion.
September 23, 2026 by Michal Mohelsky, J.D., FMVA, Principal of MMCG Invest, LLC

Michal Mohelsky, J.D. | Principal | mmcginvest.com
Contact: michal@mmcginvest.com
Phone: (628) 225-1125
MMCG Invest, LLC is a feasibility study consultant that provides independent, third-party feasibility studies for SBAand USDA guaranteed loan programs across all commercial real estate asset classes, including multifamily, hotel, industrial, retail, self-storage, senior living and mixed-use properties. Our studies incorporate absorption rate analysis, lease-up modeling, pre-stabilization cash flow bridging, pro forma and scenario-based stress testing to meet the analytical rigor required by leading government-guaranteed lenders, CDCs and institutional investors. For more information, contact our team directly.
Evaluating a development or acquisition that requires defensible absorption assumptions? Reach out to discuss how our methodology supports your lending decision.
Disclaimer: This report is provided for informational purposes only and does not constitute investment advice. Aldi and Lidl are privately held and do not file with the SEC; figures attributed to either company's U.S. operations are estimates or MMCG computations unless a company release or audited filing is cited. Data presented herein is derived from proprietary MMCG databases and third-party sources believed to be reliable; however, MMCG Invest makes no representation as to the accuracy or completeness of such information. This research was not commissioned, funded or reviewed by Aldi, Lidl, or any affiliate of either. Past performance is not indicative of future results.
Sources
(1) Aldi U.S., "ALDI U.S. Doubles Down on Growth in 2026 With Plans to Open 180 New Stores," press release, January 12, 2026 (corporate.aldi.us; PR Newswire).
(2) CNBC, "Discount grocer Aldi plans to open more than 180 stores in U.S. this year," January 12, 2026.
(3) Lidl U.S., "Lidl US opening a fresh new grocery store on Staten Island," press release, September 2, 2026 (mediacenter.lidl.com).
(4) Grocery Dive, "Lidl US appoints Alan Barry CEO," May 2026; Progressive Grocer, "Lidl US COO fills CEO position," May 2026.
(5) CNBC, "How Aldi's founders turned a local grocery into a $38 billion fortune," May 14, 2019; Private Label Manufacturers Association, Hall of Fame entry for Theo Albrecht.
(6) Federal Trade Commission, consent agreement naming ALDI Inc. as an Illinois corporation, May 1997; ALDI Inc. corporate privacy notice, Batavia, IL (accessed September 2026).
(7) Kovalev v. Lidl US, LLC, U.S. District Court for the Eastern District of Pennsylvania, Case 2:21-cv-03300, opinion filed December 20, 2024 (CourtListener; GovInfo).
(8) Schwarz Group, "Companies of Schwarz Group generate 185.6 billion euros in revenue and drive growth with investments in excess of 10 billion euros," press release, June 11, 2026, and Fiscal Year 2025 page (gruppe.schwarz).
(9) Handelsblatt (dpa), "Aldi Nord legt beim Umsatz deutlich zu," April 29, 2026; top agrar, "Aldi Nord steigert Umsatz deutlich auf 31 Mrd. Euro," April 30, 2026.
(10) WirtschaftsWoche, "Aldi Süd und Aldi Nord: Zusammen 112 Milliarden Euro Umsatz erzielt," June 20, 2024.
(11) Bloomberg Law, "Europe's Largest Retailer Signs $1.8 Billion Private Debt Deal," May 7, 2024.
(12) National Retail Federation, Top 100 Retailers 2026 list (Kantar data), published July 1, 2026.
(13) National Retail Federation, "A look at 2026's Top 50 Global Retailers," 2026 (Trader Joe's sales commentary).
(14) Placer.ai via Grocery Dive, "Aldi and Lidl foot traffic," April 9, 2024; Retail Brew, "Trader Joe's, Aldi and Lidl are on fire with foot traffic," July 17, 2025; Placer.ai Anchor, "Aldi and Lidl winning," 2025.
(15) USDA Economic Research Service, Retail Trends, food-at-home sales by outlet type, 1997 to 2025.
(16) USDA Economic Research Service, Economic Research Report No. 314, "Concentration and Competition in U.S. Food Retailing," 2023.
(17) Supermarket News, "Aldi pushes ahead with U.S. expansion," 2022 (2,000th store, 2020 and 2021 openings).
(18) TODAY, "Aldi is opening 800 new stores," March 7, 2024 (2,361 stores in 38 states).
(19) Convenience Store News, "Locations of first U.S. Lidl stores revealed," June 2017.
(20) Supermarket News, "Lidl adjusts real estate strategy," December 2017.
(21) Lidl U.S., "Lidl to acquire Best Market," press release, November 16, 2018.
(22) Virginia Economic Development Partnership, case study "Lidl launches expansion in the U.S.," updated August 27, 2026.
(23) Discount Retail Consulting GmbH, "USA: 200 Lidl stores opened in America," April 15, 2026.
(24) Grocery Dive, "Aldi at 50: a timeline of the discounter's U.S. growth," February 2022 (2013 plan, February 2017 remodel program, August 2023 Southeastern Grocers agreement).
(25) Aldi U.S., "ALDI ramps up U.S. expansion with goal of 2,500 stores by end of 2022," press release, June 12, 2017.
(26) Aldi U.S., "ALDI announces plans to open a record-breaking 225 new stores in 2025," press release, February 7, 2025.
(27) Supermarket News, "Aldi to acquire Winn-Dixie and Harveys," August 16, 2023; Southeastern Grocers, Business Wire release, August 16, 2023.
(28) Aldi U.S., "America's low-price leader ALDI expands footprint nationwide with 800 new stores by the end of 2028," press release, March 7, 2024.
(29) Grocery Dive, "Aldi sells off Southeastern Grocers business," February 2025.
(30) Germany Trade and Invest, "Deutsche Lebensmittelhändler sind in den USA auf der Erfolgsspur," 2025 (conversion format).
(31) StoreLocators, ScrapeHero and Specrom Aldi U.S. location reports, May to September 2026 (third-party estimates; national totals 2,605 to 2,687).
(32) Lidl U.S., "Lidl US announces 50 new stores by end of 2021," press release, August 25, 2020.
(33) Supermarket News, "Lidl closed 11 stores on Sunday," July 2023; Grocery Dive, "Lidl reportedly closing 5 U.S. locations," July 2023.
(34) ScrapeHero, Lidl USA location report, snapshots of August 27, 2025 and September 15, 2026 (third-party estimate).
(35) Grocery Dive, "Lidl pulls up stakes in Texas," July 2020.
(36) San Antonio Express-News via Yahoo Finance, "German discount grocer Lidl sells San Antonio land," 2026 (citing county property records).
(37) Aldi U.S., Real Estate, "Property Requirements" (corporate.aldi.us/real-estate/property-requirements), accessed September 2026.
(38) City of Madison, Alabama, planning staff report on Aldi (DocumentCenter 17659); New Haven Register, Branford Aldi hearing, May 28, 2020.
(39) Supermarket News, "Lidl details site plans for U.S. expansion," 2016.
(40) Supermarket News, "Lidl's first U.S. stores opening June 15," May 2017.
(41) Produce Market Guide, "Struggling Lidl still adapting to U.S. market," 2017 (Neil Stern, McMillanDoolittle).
(42) Grocery Dive, "Report: Lidl is dramatically scaling back its growth this year," January 19, 2018.
(43) Supermarket News / Winsight Grocery Business, "WGB exclusive: Lidl pursuing smaller sites," December 2017.
(44) Lidl U.S., Real Estate Brochure (realestate-lidl.com), undated, accessed September 2026.
(45) Commercial Observer, "Lidl inks 15-year lease at 155 East 31st Street," February 2025.
(46) The Real Deal, "Lidl adds two Queens leases to NYC spread," May 23, 2023.
(47) NJBIZ, Lidl Totowa opening coverage, February 2026; Lidl U.S. release, January 28, 2026.
(48) Supermarket News, "The forgotten story of Aldi's U.S. debut," accessed September 2026.
(49) Aldi U.S., Real Estate, "Available Properties," accessed September 2026.
(50) WGRZ / Buffalo Business First, "Aldi sells vacant land near Cheektowaga store to Taco Bell developer," 2024; BizTimes, "Former Aldi store building in Milwaukee sold" (both citing public records).
(51) Store Brands, "Aldi acquires three Big Lots locations," 2025.
(52) Jason Miller, "As Aldi targets 3,000 U.S. stores," Substack, September 9, 2025 (independent analyst estimate).
(53) Portland Press Herald via Yahoo News, "Aldi signs lease at Pine Tree Shopping Center," February 2025 (Brixmor spokesperson).
(54) Cohen & Steers Income Opportunities REIT, "Acquires Aldi-anchored shopping center in Bonita Springs, Florida," press release, December 8, 2025.
(55) JPMBB Commercial Mortgage Securities Trust 2013-C12, prospectus supplement (Form 424B5) and free writing prospectus, SEC EDGAR, 2013 (Steelyard Commons, Aldi ground lease).
(56) Supermarket News, "Lidl widens search for sites," 2018.
(57) Supermarket News, "Will Lidl's new acquisition come with a supply deal?" December 2018.
(58) The Roanoke Times, coverage of Lidl parcel sale, 2022 (citing real estate records).
(59) Lidl U.S. Real Estate, "For sale / lease" listings (realestate-lidl.com), accessed September 2026.
(60) Retail Gazette, "Lidl sale and leaseback," October 2024.
(61) ICG Real Estate, "ICG Real Estate agrees to acquire €200m European grocery store portfolio from Lidl," press release, November 20, 2025.
(62) Grocery Dive, "Lidl announces next store openings and $100M distribution center," 2017.
(63) The Roanoke Times, "Construction begins on Lidl stores," 2017; WilmingtonBiz, "Lidl store under construction set to be done by August," May 20, 2019 (building permit values).
(64) Greater Long Island, "Construction starts on what's to be the largest Lidl supermarket ever built," c. 2023.
(65) Companies House, filing histories for Aldi Stores Limited (company no. 02321869) and Lidl Great Britain Limited (company no. 02816429).
(66) Aldi UK, "Aldi announces record £1.6bn expansion plan to meet UK's 'demand for discount,'" press release, September 15, 2025 (results for the year to December 31, 2024); Reuters coverage, same date.
(67) The Grocer, "Aldi like-for-like sales were down in 2024, admits UK chief," September 2025.
(68) Lidl GB, "Financial year results: Lidl GB achieves record market share growth with 38m more customer visits," press release, October 22, 2025.
(69) Lidl GB, "Lidl GB sees highest increase in shopper visits across the sector as it celebrates 30 years," press release, November 20, 2024; Lidl GB FY21 results release, 2022.
(70) Sprouts Farmers Market, Inc., Form 10-K for the fiscal year ended December 28, 2025, filed February 19, 2026 (SEC EDGAR).
(71) The Kroger Co., "Kroger reports fourth quarter and full-year 2025 results and announces guidance for 2026," March 5, 2026 (Form 8-K).
(72) Supermarkt Inside, "Aldi Süd macht ein schönes Umsatzplus, Marktanteile aber unter Druck," March 2026.
(73) Grocery Dive, "Aldi plans to hire 13,000 new employees," September 2024; 6abc, "Aldi raises starting pay for store employees and warehouse workers," September 2024.
(74) Lidl GB, "Lidl raises pay bringing investment to over £70m in two years," press release, August 2025.
(75) Lidl U.S., grand opening announcement, May 17, 2017 (press release PDF).
(76) Store Brands, "Brendan Proctor out as CEO of Lidl US, Johannes Fieber taking over," 2018.
(77) Forbes (Mark Faithfull), "Lidl US changes CEO once more as revolving door spins again," August 8, 2023.
(78) Chain Store Age, "AlixPartners executive to take helm at Lidl US," August 2023.
(79) Grocery Dive, "Lidl US CEO Joel Rampoldt departs," January 21, 2026, and "What Lidl's executive change means for its U.S. business," January 22, 2026 (RetailStat comments).
(80) Supermarket News, "Lidl US parts with its fifth CEO in less than a decade," January 2026 (assortment cut to 3,250 SKUs).
(81) Progressive Grocer, "Lidl expands footprint in key market areas," January 2025.
(82) Reuters via Business Standard, "Tesco quits U.S. as profits fall," April 17, 2013; The Grocer, coverage of the Fresh & Easy write-down, April 2013; CNN Money, same date.
(83) Reuters via Yahoo Finance, "Tesco set to exit U.S. with Yucaipa deal," September 10, 2013.
(84) Progressive Grocer, "No surprise: Lidl's not a sure thing," 2017 (inMarket data reported by The Wall Street Journal).
(85) Store Brands, "Lidl's U.S. expansion marred by mistakes, CEO says," January 2018 (Klaus Gehrig, Manager Magazin).
(86) UNC Kenan-Flagler Business School, "Lidl significantly pressures U.S. supermarket chains to cut prices at unprecedented levels," January 2018 (Katrijn Gielens; commissioned by Lidl US).
(87) UNC Kenan-Flagler Business School, "Lidl continues to have an impact on grocery prices in the U.S.," July 2020 (Katrijn Gielens; commissioned by Lidl US).
(88) Vroegrijk, M., Gijsbrechts, E., and Campo, K., "Close encounter with the hard discounter: a multiple-store shopping perspective on the impact of local hard-discounter entry," Journal of Marketing Research 50(5), 2013.
(89) Cleeren, K., Verboven, F., Dekimpe, M., and Gielens, K., "Intra- and interformat competition among discounters and supermarkets," Marketing Science 29(3), 2010.
(90) Australian Competition and Consumer Commission, Report of the ACCC inquiry into the competitiveness of retail prices for standard groceries, July 2008.
(91) Australian Competition and Consumer Commission, Supermarkets inquiry final report, February 2025.
(92) Ellickson, P., and Grieco, P., "Wal-Mart and the geography of grocery retailing," Journal of Urban Economics 75, 2013.
(93) Arcidiacono, P., Ellickson, P., Mela, C., and Singleton, J., "The competitive effects of entry: evidence from supercenter expansion," American Economic Journal: Applied Economics 12(3), 2020.
(94) Cakir, M., Kong, X., Cho, C., and Stevens, A., "Rural food retailing and independent grocery retailer exits," American Journal of Agricultural Economics 102(5), 2020.
(95) USDA Economic Research Service, "Dollar store entry and independent grocery retailers," Amber Waves and Applied Economic Perspectives and Policy, 2024.
(96) Pope, D., and Pope, J., "When Walmart comes to town: always low housing prices? Always?" Journal of Urban Economics 87, 2015 (NBER Working Paper 18111).
(97) Wang, B., "Is Walmart the same as ten years ago? A non-parametric difference-in-differences analysis of Walmart development," Regional Science and Urban Economics 99, 2023.
(98) ATTOM Data Solutions, "2022 Grocery Store Battle" analysis, November 22, 2022 (PR Newswire release and attomdata.com).
(99) Pashigian, B. P., and Gould, E., "Internalizing externalities: the pricing of space in shopping malls," Journal of Law and Economics 41(1), 1998.
(100) UK Competition and Markets Authority, "Aldi and Lidl should be subject to the same rules as major supermarkets," provisional decision, August 7, 2026; Retail Gazette and Grocery Gazette coverage, August 2026.
(101) Gijsbrechts, E., Campo, K., and Vroegrijk, M., "Save or (over-)spend? The impact of hard-discounter shopping on consumers' grocery outlay," International Journal of Research in Marketing, 2018.
(102) Cho, C., and Volpe, R., "Independent grocery stores in the changing landscape of the U.S. food retail industry," USDA ERS Economic Research Report No. 240, 2017.
(103) Agree Realty Corporation, Form 10-K for the fiscal year ended December 31, 2025 (SEC EDGAR), tenant concentration schedule.
(104) Inland Diversified Real Estate Trust, Inc., Form 8-K, 2010 (SEC EDGAR), Aldi lease disclosure.
(105) U.S. Small Business Administration, "7(a) & 504 FOIA" open dataset and data dictionary, data.sba.gov, release as of March 31, 2026.
(106) LoanTape, "SBA FOIA LoanStatus recode," April 30, 2026 (third-party reproduction; verify against the SBA data dictionary).
(107) PeerSense, SBA loan performance by industry, NAICS 445, accessed September 2026 (commercial vendor estimate).
(108) The Grocer, "Lidl sails past Morrisons to become UK's fifth biggest supermarket," May 2026 (Worldpanel by Numerator, 12 weeks to May 17, 2026).
(109) Worldpanel by Numerator, "Irish grocery sales: summer spending," 12 weeks to June 14, 2026; RTE, Worldpanel figures for the 12 weeks to September 6, 2026.
(110) Lidl GB, "Site requirements 2022," press release, April 26, 2022, and "Site Requirements Brochure, Spring 2026" (realestate-lidl.co.uk); Retail Gazette, "Lidl reveals hit list of new UK store locations as £600m rollout ramps up," April 27, 2026.
(111) The Grocer, "UK retail parks 'effectively full' after Aldi and Lidl expansion," 2026 (Savills data).
(112) Reuters via TradingView, "Lidl GB targets market share gains with faster store expansion," October 22, 2025; SeafoodSource, Aldi UK 1,000th store, September 7, 2023.
(113) Aldi Süd, "Unternehmen, Filialen & Geschichte" (aldi-sued.de/unternehmen/ueber-uns), accessed September 2026.
(114) MMCG database, including MMCG computations from the sources above; parcel and trade-area measurements from the MMCG Analytics platform; U.S., UK and German population denominators from the U.S. Census Bureau, the Office for National Statistics and Destatis.
This report has been prepared by MMCG Invest, LLC for informational purposes. It does not constitute investment advice, a solicitation, or an underwriting opinion. Figures described as "MMCG computation" are derived by MMCG from the cited company disclosures and are not company statements. Industry data referenced as "MMCG database" reflects MMCG's recalibration of third-party sources against direct company disclosures.


Comments