
US Medical Office Market Outlook 2026: Full Waiting Rooms, Empty Pipelines
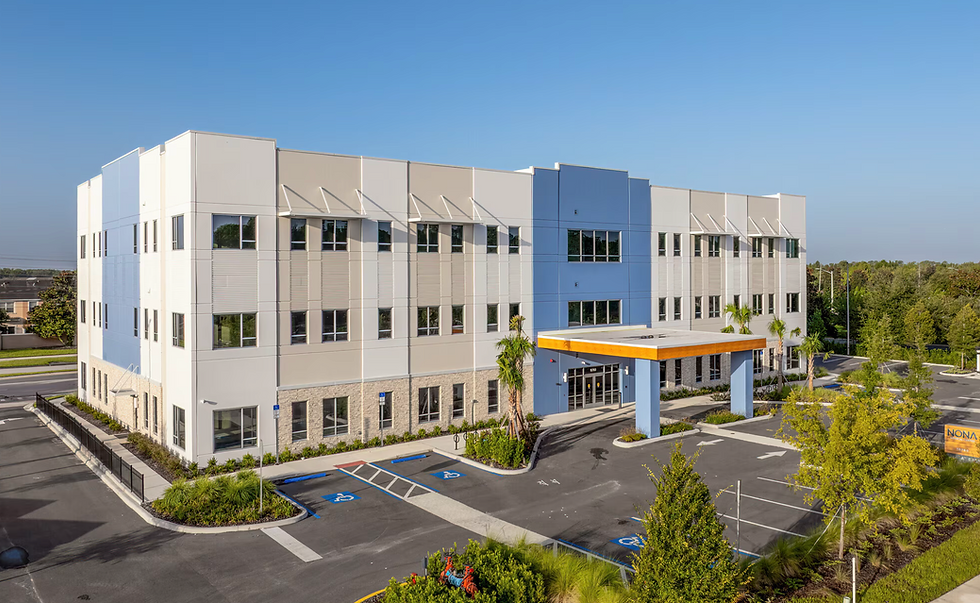
By Michal Mohelsky, J.D., principal, MMCG Invest, LLC | July 31 2026
Executive Summary
Walk the halls of a decent suburban medical building this summer and try to find an empty suite. Nationally, about one square foot in ten sits vacant. Walk a downtown office tower and the number is one in five. Both buildings get called "office" on a lender's collateral schedule, and that single word is currently mispricing an entire asset class.
This report is our attempt to price it correctly.
The case for medical outpatient buildings in 2026 rests on arithmetic that has nothing to do with sentiment. The population that uses these buildings hardest, Americans over 65, is growing by roughly four million people a year, and a 75-year-old generates more than three times the physician office visits of a 30-year-old (7)(8). Meanwhile the supply response has collapsed: construction starts fell to about 1 percent of standing inventory, the lowest reading in the data, because it now costs $400 to $560 per square foot to deliver a building that trades for $310 to $374 (2)(15)(17). Nobody builds at a guaranteed loss for long. The result is a landlord's market wearing a recession-vintage price tag.
And yet the easy version of this story, the one in every broker deck, stops exactly where the interesting part begins. The building has never looked safer. The tenant has never been more in flux. Four out of five physicians now work for a hospital or a corporate employer rather than for themselves (13). Medicare has cut physician pay 33 percent in real terms since 2001 (12). Private equity rolled up thousands of practices with borrowed money at 2021 rates, and some of those roll-ups, Steward, Envision, American Physician Partners, have already come apart in public. The credit sitting behind a medical lease in 2026 is a different animal than it was in 2012, and underwriting that hasn't noticed is underwriting from memory.
We write feasibility studies for SBA, USDA and conventional lenders for a living, so we ran the primary numbers ourselves. Our tabulation of the SBA's loan-level FOIA files, 71,799 medical 7(a) loans and 12,616 medical 504 loans from FY2010 through March 2026, shows medical borrowers charging off at 2.89 percent of disbursed loans against 4.66 percent for the whole SBA book, and dentists who bought their buildings through the 504 program charging off 0.24 percent of loans over sixteen years (1). The same files also show medical 504 volume down 68 percent from its 2021 peak. Practices kept borrowing. They stopped buying buildings. When the borrowers themselves make that trade, the market is telling you something about the cost of money that no cap-rate survey will.
What follows runs about eight thousand words: the demand engine and its genuine bear case, the tenant credit migration, the development math that froze the pipeline, the regulatory machinery that decides schedules and rents, the capital markets and the leverage arithmetic, our SBA tape, the operating pro forma, and the geography, because the national average never governs a submarket. The short version: buy or hold the building, underwrite the tenant like it is 2026, and do not build without a number that clears 8.5 percent on cost.
Twenty Numbers That Define the Market
9.8 percent: national medical outpatient building vacancy, Q4 2025, against 18.6 to 21.0 percent for traditional office (2)(4)(6).
$25.40 per square foot: record national average MOB asking rent, triple net, up 1.6 percent year over year (2).
1.6 billion square feet: national MOB inventory across roughly 42,000 buildings of 7,500 square feet or more (5).
11,400 per day: Americans turning 65 at the 2025 peak of the "Peak 65" wave (7).
3.2x: office-visit rate of adults 65 and over versus adults 18 to 44 (550 vs 173 visits per 100 persons per year) (8).
18 percent: forecast growth in adult outpatient volumes over the next decade (10).
42.2 percent: share of physicians remaining in private practice, down from 60.1 percent in 2012; roughly 82 percent now work for hospitals or corporate entities (12)(13).
33 percent: decline in Medicare physician pay since 2001, adjusted for inflation, while practice costs rose 59 percent (12).
5 to 10 percent: occupancy cost as a share of a typical physician practice's revenue, which is why medical tenants renew instead of moving (14).
$400 to $560 per square foot: all-in cost to deliver a new MOB, against $310 to $374 for existing buildings, which is why almost nothing gets built (2)(15)(17).
$412 per square foot: all-in medical fit-out cost from a warm shell, per the 2026 JLL guide; hard costs alone run $226 (15).
1.0 percent of inventory: construction starts at the Q4 2024 trough, near the lowest on record (2)(5).
6.9 percent: average MOB cap rate, Q1 2026, the first sub-7 reading since Q3 2024 (2).
7.19 to 8.29 percent: loan constants at mid-2026 debt pricing, which makes entry leverage break-even to mildly dilutive against that 6.9 cap (3)(27).
$7.2 billion: Welltower's exit sale of 296 outpatient buildings to Remedy and Kayne Anderson, creating the largest MOB owner in the country at 52.4 million square feet (24).
93.5 percent: Healthcare Realty's tenant retention in Q1 2026, a company record, alongside 6.9 percent same-store cash NOI growth (25).
2.89 percent versus 4.66 percent: charge-off rate of medical SBA 7(a) loans against the whole SBA book, FY2010 through March 2026, per our tabulation of loan-level FOIA data (1).
0.24 percent: charge-off rate, by loan count, of dentists who financed their buildings through the SBA 504 program since 2010 (1).
68 percent: decline in medical 504 loan volume from the FY2021 peak, even as medical 7(a) lending set a record; practices kept borrowing and stopped buying buildings (1).
0.9 to 12.5 percent: the spread in metro MOB vacancy, Tulsa to Suburban Maryland, which is the whole argument for underwriting the submarket instead of the national average (34).
1. Two Markets Wearing the Same Name
Start with the ruler problem, because most of the bad analysis in this sector comes from mixing rulers.
CBRE, measuring roughly 1.6 billion square feet of purpose-built medical outpatient space, puts national vacancy at 9.8 percent as of late 2025 and holds that the rate has lived inside a 9.5 to 10.5 percent band for a decade (2). Revista, measuring the top 100 metros with a 7,500-square-foot floor, reports 92.7 percent occupancy, an implied 7.3 percent vacancy (5). Transwestern, counting buildings of 10,000 square feet and up, prints 5.8 percent direct vacancy (34). All three are right. They are measuring different universes, and any article or credit memo that ranks metros across providers, or quotes "MOB vacancy" without naming the ruler, has already made its first error.
Whichever ruler you pick, the distance to conventional office is the story. CBRE's Q1 2026 office read is 18.6 percent nationally; Cushman & Wakefield and Moody's have printed 20 and 21 percent records for the broader stock (4)(6). Office rents are being propped up by concession packages that gut net effective rent. MOB asking rents just set an all-time high of $25.40 triple net, and new construction commands $33.06 against $24.78 for existing product, a 33 percent premium that tells you what replacement economics require (2)(5).
Pricing has noticed. The average MOB now trades around $310 per square foot against roughly $200 for traditional office, the cleanest like-for-like spread in the data, and MOB cap rates re-compressed to 6.9 percent in the first quarter of 2026, the first sub-7 print in six quarters (2). Investment volume, which troughed at $1.4 billion in Q1 2024, ran $2.9 billion in Q1 2026, up 78 percent year over year, and $8.2 billion in Q4 2025 with the Welltower portfolio sale inside it (2)(24).
One caution belongs in this section rather than the risk list, because it disciplines everything downstream. The sector's favorite statistic, tenant retention "above 80 percent," is real but softer than it looks. The hard, filed numbers are REIT-specific: Healthpeak reported 79 percent retention in Q1 2026 and Healthcare Realty a record 93.5 percent (25)(26). The generic "85 percent" that circulates in marketing decks is survey-grade. We use the filed numbers, and later in this report we put a dollar figure on what that retention is actually worth per square foot, because nobody else has.
2. The Demand Engine, and the Honest Bear Case
The demand argument for medical outpatient space is demographic, and demographic arguments have the useful property of being already born. Every patient who will be 75 in 2036 is 65 today.
Adults 65 and over generate about 550 physician office visits per 100 persons per year, against 173 for adults 18 to 44 (8). Spending follows the same curve and steepens: CMS's age tables show per-capita personal health spending of roughly $36,000 for the 85-and-over population against about $4,200 for children (9). The 65-plus population grew 9.4 percent just from 2020 to 2023, to 59.2 million, and rose in 386 of the country's 387 metro areas (7). The turning-65 wave peaked in 2025 at 11,400 people per day and runs above four million a year through 2027; the deeper story is the 85-plus cohort, which roughly doubles to 14.4 million by 2040 (7). Sg2's system-planning forecast, the one hospital strategists actually build to, calls for 18 percent growth in adult outpatient volumes over the decade (10).
Two structural shifts convert those bodies into demand for buildings rather than beds. First, care keeps migrating out of the hospital: hospital outpatient revenue rose from 52 to 57 percent of total hospital revenue between 2020 and 2024, and the CY2026 Medicare outpatient rule began a three-year phase-out of the Inpatient Only list, moving 285 procedures toward outpatient settings on January 1, 2026 with the list gone by 2029 (9). Second, the procedural end of that migration keeps landing in ambulatory surgery centers, 6,436 of them Medicare-certified and counting (9). Every IPO-list procedure that leaves the hospital needs an exam room, a pre-op bay or an OR somewhere, and that somewhere is the asset class in this report.
Telehealth, the pandemic-era bear case, settled rather than conquered: about 5.5 percent of commercial claims, concentrated overwhelmingly in behavioral health, which is roughly two-thirds of all telehealth volume (9). Exam-room demand for everything that requires hands, imaging or a scalpel came back intact. The one specialty where a landlord should genuinely discount square-footage demand is pure talk-therapy behavioral health.
Now the honest bear case, because a feasibility firm that only writes the bull case is a marketing firm.
The first constraint is clinicians. The AAMC projects a physician shortfall of 13,500 to 86,000 by 2036, and HRSA's competing model runs higher still (11). A market cannot absorb space it has no one to staff; we return to this in the geography section, because the shortage is savagely uneven, Massachusetts fields 460 active physicians per 100,000 people and Idaho 184 (11).
The second is the payer. Public Law 119-21 is the largest coverage contraction in the modern data: CBO projects roughly 10 million more uninsured by 2034 from the Medicaid provisions alone, and north of 14 million once enhanced ACA subsidies lapse, with the effects ramping through 2027 to 2029 (36). Uninsured patients do not stop getting sick; they stop generating collectible visits. Tenants with Medicaid-heavy and marketplace-heavy panels, community clinics, some primary care, some behavioral health, will feel it first, and the exposure varies wildly by state, which is an underwriting variable, not a footnote.
The third is the corpse pile of the last cycle's easy thesis. "Healthcare meets retail" was going to eat this asset class. Instead, Walmart Health closed all 51 clinics in 2024, Walgreens shuttered around 160 VillageMD locations, and CVS cut Oak Street openings (2)(9). Payer-owned and retailer-owned primary care lost money at scale and gave the space back. The lesson isn't that demand is weak. It's that demand accrues to providers who can actually bill for complexity, which is to say the traditional physician, hospital and specialty ecosystem that occupies purpose-built medical space. The buildings won. Some of the business models renting them did not, which is the perfect bridge to the least-analyzed subject in the sector: who exactly is on the other side of the lease.
3. The Tenant Has Never Been More in Flux
Here is the number that should reorganize every rent roll review in the sector: 42.2 percent. That is the share of American physicians still in private practice as of 2024, down from 60.1 percent in 2012 (12). Count employment the other way and roughly 82 percent of physicians now work for hospitals, health systems or corporate entities, and corporate employers passed hospitals as the larger bucket back in January 2024 (13). The doctor-owner who signed a fifteen-year lease with a personal guaranty and hung his name on the monument sign is a shrinking minority. What replaced him is three different credits wearing one white coat.
Tier one: the health system. Near-investment-grade paper, the anchor every lender wants, and the reason hospital-affiliated buildings price 50 to 100 basis points inside the field. The catch is that this tenant's rent-paying capacity off campus is now a function of Medicare site-neutral policy, which we take up in Section 5, and its willingness to pay is bounded by federal fraud law, not by the market.
Tier two: the platform. Private equity consolidated physician practices, dental groups and veterinary clinics through the cheap-money years, and the leverage came due. Steward Health Care, carrying master-lease obligations that ballooned to roughly $6.6 billion after the sector's most infamous sale-leaseback, filed in May 2024 and closed hospitals whose adjacent medical buildings lost their referral anchor overnight (39). Envision went through bankruptcy with $7.7 billion of debt after its KKR buyout; American Physician Partners simply shut down. In dentistry, DSO penetration more than doubled from 7.4 percent of dentists in 2015 to 16.1 percent in 2024, and 2026 has already produced out-of-court restructurings at two large platforms (12). Physician-practice bankruptcies eased from the 2023 peak, then rose 33 percent quarter over quarter in early 2026 (12). None of this means platform tenants are bad tenants. It means the credit is the sponsor's balance sheet, not the specialty, and a lease guaranteed by a leveraged management company deserves corporate credit analysis, not a stethoscope discount.
Tier three: the independent. The remaining private practice is a small business with a personal guaranty, and the macro squeeze on it is not subtle: Medicare physician payment has fallen 33 percent in real terms since 2001 while the cost of running a practice rose 59 percent (12). The CY2026 fee schedule delivered a 2.5 percent one-year patch and, for the first time, split the conversion factor in two; the patch expires in 2027 (9). Veterinary, the darling specialty, logged visit declines of 2.3 percent in 2024 and 3.1 percent in 2025, a reminder that even fortress specialties cycle (12).
So why on earth would anyone call this asset class safe? Because of the fourth number, the one that reconciles everything: occupancy cost. Rent plus operating pass-throughs runs 5 to 10 percent of a typical physician practice's revenue, against roughly 60 percent for labor (14). Dental lenders start asking questions above 10 percent of collections; veterinary underwriting lives at 5 to 8 percent (14). A tenant whose rent is a rounding error against payroll does not blow up its practice to save two dollars a foot, especially after sinking $100-plus per square foot of its own money into plumbing, shielding and cabinetry that cannot move. That is the machinery behind 79 to 93.5 percent retention (25)(26), and behind the sector's proudest wartime statistic: Welltower collected about 99 percent of outpatient medical rent in the worst quarter of 2020 (24).
Put the two truths together and you get the sentence this entire report keeps circling back to, and the one our SBA tabulation will prove with sixteen years of loan-level data in Section 7: the building is safer than the operator. Lease to the specialty and the location; underwrite the entity actually signing.
4. Why Nothing Pencils: The Math That Froze the Pipeline
The most bullish fact about this market is a construction estimate.
Delivering a new multi-tenant medical building in 2026 costs $400 to $560 per square foot all-in, land through lease-up, with recent projects printing at the top of that band (15)(17). A developer underwriting to a sane spread, about 200 basis points of yield on cost over the 6.9 percent exit cap, needs an untrended return near 8.5 to 9 percent (3). Run the division and the building must open at $40 to $48 per square foot triple net. New construction actually achieves $33 to $35 (2)(5). That gap, not demand, is what killed the pipeline. Starts fell to roughly 1 percent of standing inventory at the trough, near the lowest reading in the modern data, and the national under-construction total of about 33.5 million square feet is barely 2 percent of stock (2)(5).
Where does the cost come from? Not the shell. The 2026 JLL fit-out guide puts a medical interior at $412 per square foot all-in from a warm shell, $226 of it hard cost, with high-acuity suites 30 percent above that (15). The medical premium over ordinary office runs $75 to $200 per square foot and hides in the systems: air-change rates and HVAC sized for clinical ventilation, medical gas, plumbing in nearly every room, emergency power, lead and RF shielding, floor loading for imaging equipment, infection-control finishes, and pharmacy compounding rooms built to USP standards (15)(22). Mechanical, electrical and plumbing alone absorb roughly 30 percent of a healthcare budget. The Turner index, the construction-cost benchmark, sits 34 percent above 2019 (16). Landlords typically offer $40 to $120 per square foot in tenant improvement allowance against $200 to $412 of actual build cost, so either the tenant funds the gap out of pocket, which welds them to the suite, or it amortizes into rent, which is why face and effective rents diverge more here than anywhere else in commercial real estate (15).
Then there is parking, the quiet deal-killer. Observed demand at medical buildings runs 3.23 spaces per thousand square feet; municipal codes routinely demand four to five (18). The difference between a surface-parked site and a structured deck at $20,000 to $70,000 a stall is roughly $135 per square foot of project cost, enough by itself to flip a marginal deal to infeasible.
The investment conclusion writes itself and the market has already reached it. Existing buildings at $310 to $374 per square foot trade meaningfully below replacement cost (2)(5). Buying beats building almost everywhere, supply stays constrained through at least 2028 because a start today delivers in 2028, and every renewal negotiation happens in the shadow of what replacement space would actually cost. Landlords holding standing product own an option the market cannot reprint. For developers, the honest advice from a firm that gets paid to bless projects: without a pre-leased anchor at above-market rent, a land basis near zero, or a CON-protected use, the 2026 pro forma does not clear, and a feasibility study that says so before you buy the land is cheaper than the version you commission for the workout.
5. The Rulebook Decides the Schedule, and the Rent
Broker reports treat regulation as scenery. In this asset class it is the plot. Three bodies of law decide whether your project gets built on schedule, what may lawfully happen inside a suite, and what rent a large class of tenants is even allowed to pay.
Certificate of Need decides the calendar. Thirty-five states plus the District still operate CON programs as of the December 2025 national scan, fifteen do not, and coverage of surgery centers and imaging varies inside the CON states (19). The deregulation wave is real: South Carolina repealed most of its program on signature in May 2023, Tennessee ends ASC review on December 1, 2027, North Carolina exempted ASCs in counties over 125,000 people, and Georgia carved out single-specialty physician ASCs up to $2.5 million, though a North Carolina trial court upheld that state's CON law in December 2025 and West Virginia's full repeal failed (19). The stakes are quantified in the economics literature: repeal raises surgery centers per capita 44 to 47 percent statewide and roughly doubles them in rural areas (37). For a schedule, the overlay is blunt. A simple medical fit-out adds one to three months of regulatory time anywhere. An imaging center adds three to nine months in a free state and six to eighteen with CON. A licensed ASC adds six to twelve months in a free state and twelve to thirty or more where CON applies, with six-figure soft costs and competitor appeals that can convert months into years (19). We build that overlay into every feasibility schedule, and lenders should treat CON approval as a condition precedent to closing, not a post-closing chore.
Life-safety classification decides the budget. Under NFPA 101, the moment four or more patients in a suite are simultaneously incapable of self-preservation, sedation counts, the space stops being ordinary business occupancy and becomes ambulatory health care occupancy, with the sprinkler, egress, fire-separation and emergency-power requirements that follow (22). Misclassify at schematic design and you retrofit at multiples of the original delta. It is the single most expensive checkbox in outpatient development, and it is routinely checked wrong.
Federal fraud law decides the rent. This is the part of medical real estate that has no analogue anywhere else. When a landlord and a physician tenant are in a position to refer to one another, the Stark law's space-rental exception and the Anti-Kickback safe harbor govern the lease: written agreement, at least a one-year term, rent set in advance at fair market value, commercially reasonable, exclusive use, and never determined in a way that takes into account the volume or value of referrals (20). The 2020 modernization rule, effective January 2021, tightened the definitions (20). The enforcement record is why nobody should treat this as theoretical: $72.3 million from an Oklahoma surgical hospital group whose sins included free and below-market space for referring physicians; $12.76 million from Dunes Surgical Hospital in 2024; $16.5 million from HCA; a $10 million laboratory settlement over above-market rents paid to physician landlords; and a New York diagnostic firm that admitted sham "rent" scaled to referral volume (21). Above-market rent and below-market rent are both federal cases in this sector. Every medical lease file involving a referral source needs an independent fair-market-value rent opinion, dated at or before commencement and refreshed at renewal, and a lender should demand it like an appraisal, because if the arrangement unwinds, the income underpinning the collateral unwinds with it. Producing exactly that documentation is a meaningful share of our practice, which tells you how often it is missing.
And site-neutral payment decides what a hospital tenant can pay off campus. Since the Bipartisan Budget Act of 2015, new off-campus hospital departments bill at roughly the physician-office rate rather than the richer hospital rate; departments grandfathered in 2015 keep the premium but generally lose it if they relocate, which quietly freezes health systems in place (23). The CY2026 rule extended site-neutral payment to drug administration in those grandfathered sites at about 40 percent of the hospital rate, a $290 million annual cut (9). Every extension shrinks the reimbursement premium that historically let hospitals pay above-market rent off campus. Underwrite hospital-tenant buildings to the rent a freestanding physician group could pay, and treat anything above that as policy risk with a lease attached.
6. Capital Markets: The Money Came Back Before the Leverage Did
The financing famine is over. In CBRE's 2026 investor survey only 11 percent of respondents named financing availability their top concern, down from 27 percent a year earlier; 86 percent are using bank debt, debt funds gained the most share, all-cash deals fell from 41 to 33 percent of transactions, and leveraged IRR reclaimed its place as the dominant return metric (3). The buyer base rotated rather than retreated: private and institutional capital took over 80 percent of 2025 volume, Welltower sold $7.2 billion of outpatient buildings to Remedy and Kayne Anderson in tranches beginning October 2025, and the buyers of that portfolio became the largest owner of medical outpatient buildings in the country at 52.4 million square feet (5)(24). Health systems remained net sellers of their real estate, and the best private prints ran tighter than the survey average: Healthpeak recapitalized a stabilized outpatient venture with Blackstone at a 6.1 percent cash cap rate in early 2026 (26).
Who actually lends, and on what terms? Banks quote roughly 6.0 to 7.5 percent at 65 to 75 percent of value, usually with recourse. Life companies are the price setters at 4.99 to 5.50 percent, 55 to 65 percent of value, non-recourse, for stabilized assets of institutional size. CMBS runs 6.5 to 8.0 percent with debt-yield floors of 10 to 12 percent. Debt funds bridge the transitional deals. And the SBA 504 finances owner-occupants to 90 percent of cost, which we treat separately in the next section because it deserves it (3)(27)(28)(29). Two facts that borrowers persistently get wrong: Fannie Mae and Freddie Mac do not finance medical office, full stop, their programs are multifamily; and HUD's Section 232 covers residential care, not outpatient buildings (27). There is no agency bid in this asset class. There never was.
Now the arithmetic that decides whether any of that debt helps you. A loan constant is annual debt service divided by loan amount. At a 5.25 percent life-company coupon on 25-year amortization the constant is 7.19 percent. A bank loan at 7 percent over 30 years runs 7.98; at 6.75 over 25, 8.29 (27). Set those against a 6.9 percent going-in cap rate and every conventional structure produces negative or break-even leverage on day one. Buyers are not being paid to borrow; they are underwriting to 2 to 3 percent escalators, the gap between in-place and market rents, and the replacement-cost floor beneath pricing. That is a rational trade in this sector precisely because the income is durable, but it has a discipline attached: the deal must work at the cap rate, unlevered, or it does not work. And in loan sizing, debt yield binds before loan-to-value: at a 6.9 cap, a 10 percent debt-yield floor caps proceeds near 69 percent of value and a 12 percent floor near 57.5 (27). The LTV in the term sheet is decoration; the debt yield is the loan.
One absence in the data is itself a finding. Medical office is not separately tracked in CMBS delinquency reporting. Trepp, KBRA and the rating agencies fold it into "office," where delinquency peaked at 12.34 percent in January 2026, a record driven by towers, not clinics (27). Any lender benchmarking a medical building against the office delinquency series is importing distress that MOB fundamentals, 9.8 percent vacancy, record rents, record retention, simply do not exhibit. Until the data vendors split the series, the best public proxy for how these loans actually behave is the government's own loan tape. So we tabulated it.
7. The SBA Tape: What 84,000 Loans Say About Medical Credit
Because we write studies for SBA lenders, we maintain our own tabulation of the agency's loan-level FOIA files. The current cut covers 71,799 medical 7(a) approvals and 12,616 medical 504 approvals from fiscal 2010 through March 31, 2026, roughly $41.7 billion of medical, dental and veterinary credit, with every figure below stated against a named denominator, because the denominator is where most published SBA "default rates" go wrong (1).
Medical beats the book on every measure. Across all vintages, medical 7(a) loans charged off at 2.89 percent of disbursed loans against 4.66 percent for the entire SBA portfolio; 1.26 versus 1.75 percent of dollars; and 4.76 versus 7.50 percent on the broadest trouble measure, which counts loans the SBA has purchased or placed in liquidation but not yet written off (1). On the fully seasoned 2010 to 2016 cohort, loans that have had a decade or more to fail, the gap holds: 3.97 against 6.11 percent. This is not a young-vintage illusion. Medicine is simply a better credit than American small business at large, by about a third, through a full cycle.
But "medical" is not one credit; the internal spread is six to one. Veterinary practices charged off 1.32 percent of loans, dentists 1.76, optometrists 1.92. At the other end: home health 4.53, medical laboratories 4.62, and ambulance services 8.41 percent, worse than the average restaurant cohort (1). Split the seasoned book into office-based, building-using specialties, physicians, dentists, optometry, therapy, surgery centers, imaging, veterinary, against the rest, and the building users default at 3.0 percent while the non-building half runs 6.2 (1). The specialties that need real estate are, almost perfectly, the specialties that repay. A lender's instinct that a dental building is safer than a home-health contract is not folklore. It is in the tape.
The cleanest real-estate read is the 504 program, and it may be the best-kept secret in commercial credit. The 504 is, by definition, owner-occupied real estate. Medical 504 loans charged off at 0.74 percent of loans and 0.59 percent of dollars since 2010, against 0.97 and 0.71 for the whole program. And the single most quotable number in our entire dataset: dentists who financed their buildings through the 504 charged off 0.24 percent of loans and 0.13 percent of dollars across sixteen years (1). Roughly one dental-building loan in four hundred. There are investment-grade bond cohorts with worse loss experience.
One correction we imposed on ourselves, and every reader should impose on anyone quoting this data. Our first cut showed 25-year medical real-estate paper charging off at 0.02 percent, a number so good it demanded suspicion. The control confirmed the suspicion: 25-year SBA paper charges off at 0.02 percent in every industry, medical or not. The near-zero loss rate on long real-estate loans is a collateral effect, not a medical one. The mechanism is the interesting part: 25-year medical loans from the 2010 to 2014 vintages reached payoff in a median of 5.9 years, and 81 percent are already retired, because owners refinance into conventional debt or sell the building long before the loan can fail (1). The building resolves the credit. What is genuinely a medical effect is that at every matched term bucket, medical charges off 25 to 40 percent less than the rest of the book. Both findings support the same thesis; only one of them is allowed to wear the white coat.
The live story in the tape is that the borrowers stopped buying buildings. Medical 504 volume peaked in fiscal 2021 at 979 loans and $1.47 billion of project cost, then fell to 315 loans and $429 million by fiscal 2025, down 68 percent by count, while medical 7(a) lending set an all-time record of 4,623 loans and $2.57 billion the same year (1). Inside the 7(a), the real-estate share of medical dollars slid from 62 percent in 2021 to 49 percent. Practices kept borrowing for acquisitions, equipment and working capital, and quit acquiring real estate. That is the owner-occupant reaching the same conclusion as the developer in Section 4 and the investor in Section 6: at these constants, the building math is marginal. When rates broke, the tape moved before the surveys did; it will signal the turn the same way. Worth noting: borrowers who did put a building behind the loan paid for the privilege of safety at a discount, real-estate-length medical 7(a) paper priced roughly 250 basis points inside shorter medical loans in fiscal 2024 and 2025 (1).
The rulebook, briefly, because it moved. The controlling manual is SOP 50 10 8, effective June 1, 2025. Medical buildings are special-purpose property under it, which raises the borrower's equity to 15 percent, 20 for a startup, and requires a going-concern appraisal from a certified general appraiser (28). Since March 1, 2026, every direct and indirect owner must be a U.S. citizen or lawful permanent resident. Since July 4, 2026, the 7(a) and 504 caps are decoupled: a borrower can carry $5 million of each, $10 million combined, with the 7(a) approved first (28). The 504 priced at roughly 6.2 percent all-in this July, fixed for 25 years, which against the bank quotes in Section 6 is the cheapest long-term fixed-rate real estate money a practice can legally obtain (29). And on the rural side, USDA raised its Business & Industry guarantee to 85 percent for loans under $5 million in March 2026, while its regulations prescribe, verbatim, a five-factor feasibility study, economic, market, technical, financial, management, for guaranteed loans; a study missing a factor gets the application returned (30). With 734 rural hospitals at risk, 44 converted to the new Rural Emergency Hospital designation, and $50 billion of Rural Health Transformation money flowing to states through 2030, the rural outpatient build-out is where that requirement will bite hardest (31).
8. Running the Building: The Pro Forma Nobody Publishes
Broker reports end at asking rent. Feasibility begins at expenses, so here is the operating layer, anchored to filed numbers rather than folklore.
The best public benchmarks are the REITs' own books: Welltower's outpatient segment ran operating expenses at 30.6 percent of revenue in its FY2024 annual report, a 69.4 percent margin, and Healthpeak's outpatient portfolio near 33.7 percent (24)(26). For a typical multi-tenant building that translates to $8 to $12 per square foot of operating cost. The medical premium over ordinary office is smaller than intuition suggests, roughly $1.50 to $3.00 per square foot, because the largest line, property taxes, does not care what you practice. The premium hides in energy and waste: medical office runs a site energy intensity of 97.7 kBtu per square foot against 52.9 for office, essentially double, on air changes and equipment (32), plus a regulated medical-waste line office never carries.
Who pays it? Mostly the tenant. Healthcare Realty's filings show about 92 percent of leased square footage carries expense recovery, roughly 63 percent net and 29 percent modified gross (25). Model 90 to 92 percent recovery, never 100; the leakage from vacancy, caps on controllables and excluded items is real.
Three operating traps earn their own sentences. First, property-tax reassessment on sale: automatic in California, Texas, Florida and most states, and if the seller is a tax-exempt health system, the exemption dies at closing; underwriting the seller's tax bill is the single most common error we correct in acquisition pro formas. Second, insurance finally turned, property rates fell 8 to 10 percent in late 2025 and early 2026 after a brutal run, but casualty is still hardening, so re-quote rather than trend (33). Third, reserves: healthcare HVAC replacement runs $38 to $140 per square foot against $14 to $34 for office, so we underwrite $0.25 to $0.40 per square foot of reserves where office convention says a dime (32).
Assemble it for a hypothetical 60,000-square-foot multi-tenant off-campus building at 2026 benchmarks: $25.40 asking rent, 92.7 percent occupancy, 92 percent recovery on $10 of expenses, and you land near $32.28 of effective gross income, $11.39 of expenses, and $20.88 of net operating income per square foot, about $1.25 million (1)(2)(5)(25). At the 6.9 cap that values the building near $18.2 million, or $303 per square foot, at the bottom of the trading range and far beneath the $400-plus it would cost to rebuild, which independently re-derives Section 4's conclusion from the income side. At 65 percent leverage the debt service covers 1.28 to 1.48 times with a 10.6 percent debt yield. The building carries its debt at moderate leverage. It just doesn't make borrowing look clever.
And the number nobody prices: retention. Turning over a specialized suite costs on the order of $103 to $180 per square foot of that suite, new tenant improvements at current cost, commissions, and six to eighteen months of vacancy, against a renewal where Healthpeak reports tenant-improvement outlay below 5 percent of rent (15)(26). Amortized across a portfolio, the sector's 80-to-93-percent retention is worth roughly $2 to $4 per square foot per year of avoided re-leasing cost. That, in dollars, is the safe-haven premium. It is earned, not sentimental.
9. Geography: The National Average Governs Nothing
Everything above is a national number, and no national number ever underwrote a building. Metro medical vacancy in 2026 runs from 0.9 percent in Tulsa to 12.5 percent in Suburban Maryland on a single provider's consistent ruler, an eleven-point spread that swallows the entire national office-versus-medical story (34).
The counterintuitive part, the one the trade press keeps getting backwards, is where the softness lives. The highest big-metro medical vacancies in the country are Sunbelt: San Antonio at 11.1 percent, Houston 10.9, Phoenix 10.7, Dallas-Fort Worth 9.2 (34). Not because Sunbelt demand disappointed, Houston led the nation in absorption, but because supply chased it: Texas, Florida and California will host more than half of 2025's national completions (35). Meanwhile the disciplined, slow-growth Midwest runs the tightest boards in America: Minneapolis 3.5 percent, St. Louis 4.2, Cleveland 4.3, Columbus 4.6, Des Moines under 3 (34). Institutional capital compressed Sunbelt cap rates on the growth story, so in several Sunbelt metros an investor now accepts a lower yield and higher vacancy risk than in a Midwest market with a fraction of the pipeline. "Sunbelt" is a demand tailwind. It was never a fundamentals guarantee.
Where would we recommend building, if a client insisted on building? At the intersection of high senior growth and an empty pipeline: Raleigh/Durham, whose older-adult population grew 18 percent from 2020 to 2023 while its construction pipeline is a rounding error; Charlotte at 95-percent-plus occupancy; Tampa; St. Louis, which posted the country's strongest absorption against zero new supply (7)(34). Where would we counsel patience? Anywhere the pipeline exceeds about 2 percent of stock, Omaha currently carries 10.1 percent of its inventory under construction, and the overbuilt Texas metros until they digest (34)(35).
The state overlay changes underwriting as much as the metro does. The same clinic building carries a different payer risk in Texas, 16.7 percent uninsured, no Medicaid expansion, maximal exposure to the P.L. 119-21 coverage ramp, than in Massachusetts at 2.8 percent uninsured with 460 physicians per 100,000 people (11)(36). Our own SBA tape adds a wrinkle no broker tracks: real-estate-secured lending is 36 percent of California's medical loans and 9 percent of Massachusetts's, growth markets buy their buildings, dense legacy metros lease (1).
And below the metros sits the honest frontier: rural America, where 63 percent of primary-care shortage areas sit, where the $50 billion rural health program and USDA lending will finance the next outpatient build-out, and where no brokerage publishes a single vacancy number (31)(38). There is likewise no published standard for a medical trade area; the sector borrows hospital planning's primary service area, the ZIP codes producing about 75 percent of patient origin, and drive-time rings, and there is no accepted square-feet-per-thousand-residents benchmark at all. We say this without embarrassment, because that gap is precisely what a site-specific feasibility study exists to close, and precisely why lenders in uncovered markets commission one (1).
Where the Opportunities Are
Buy standing product below replacement cost. The $310-to-$374 market against $400-to-$560 replacement is the cleanest arbitrage in healthcare real estate, and every renewal cycle marks rents toward replacement economics (2)(15).
Own the renewal. With turnover costing $103 to $180 per square foot of suite and retention above 90 percent at the best operators, the cash flow behaves like amortizing infrastructure. Buildings with health-system anchors, in-place rents below market, and documented Stark-compliant leases deserve the tightest pricing and get it (25)(26).
Owner-occupants: the contrarian window. The 504 collapse means practices stopped buying exactly when long-term fixed money at roughly 6.2 percent, 90 percent of cost, decoupled $10 million capacity, and sub-1-percent historical loss rates argue the opposite for a durable practice (1)(28)(29). The practice that buys its building in 2026 buys against thin competition from its peers.
Build only where the intersection holds. High senior growth, sub-2-percent pipeline, clinician supply, and either an anchor tenant or CON protection: Raleigh/Durham, Charlotte, Tampa, select Midwest infill (7)(34).
Rural, with USDA paper. Fixed-payment Rural Emergency Hospitals, $50 billion of transformation funding, an 85 percent guarantee, and no institutional competition for the data or the deals (30)(31).
The compliance economy. Every referral-source lease needs an FMV rent opinion; every USDA deal needs a five-factor study; every ASC needs a regulatory calendar. The paperwork is not overhead. In this sector the paperwork is the moat.
Where the Risks Are
Policy is the big one. Site-neutral expansion keeps shrinking what hospitals can pay off campus; the P.L. 119-21 coverage losses ramp through 2027 to 2029 and land hardest on Medicaid-heavy tenants in non-expansion states; the 2.5 percent physician-fee patch dies in 2027 (9)(12)(36). Tenant credit migration is the quiet one. Every year the rent roll shifts from personally guaranteed owners toward employed-physician entities and leveraged platforms; the Steward lesson, that a lease is only as good as the sponsor and the rent coverage behind it, transfers fully to medical office (39). Local oversupply is the avoidable one. The Sunbelt pipeline concentration means 2026-27 deliveries hit Houston, Dallas, Phoenix and Orlando specifically (35). And the math risk is negative leverage itself: buyers underwriting to escalators and exit compression are short the ten-year Treasury whether they admit it or not; a sustained move above 5 percent re-widens cap rates and re-freezes the bid. Add the perennial pro forma killers, tax reassessment on transfer, misclassified life-safety occupancy, an unbanked FMV rent file, and the risk list is really a checklist for whether the underwriting was done at all.
Outlook to 2031
Our base case is unexciting, which for lenders is the point. Vacancy stays in its long-run 9-to-10.5-percent band through 2028 simply because supply cannot respond: everything delivering through 2027 is already visible, and it is small. Rents grind 2 to 4 percent annually with new-construction economics pulling the top of the market toward $40, and the in-place-to-market gap does the heavy lifting for owners. Cap rates hold the high 6s, with 25 to 50 basis points of compression if the Fed delivers the cuts the surveys expect, and the best hospital-anchored product continuing to print near 6 (3). Construction does not restart in earnest until achievable rents clear roughly $40 to $48 against today's costs, call it 2028 to 2030 in the strongest metros, later everywhere else, unless building costs break, which nothing in the Turner index suggests (15)(16). Transaction volume keeps normalizing toward and past the mid-teens in billions as the remaining bid-ask closes and the Welltower portfolio's new owners season the market with scale comps (2)(24).
The structural wildcards run in opposite directions. Coverage contraction and site-neutral expansion pressure tenant revenue into the back half of the decade. The 85-plus population, the heaviest users of every service in these buildings, doubles by 2040 and does not care about any of it (7)(9). We know which force we would rather be long, and it is the one that has already been born.
Frequently Asked Questions
Is medical office the same asset class as office? No, and the data has stopped being polite about it: 9.8 percent vacancy against 18.6 to 21, record rents against record concessions, $310 a foot against $200, and retention above 90 percent at the best operators (2)(4)(25). The word "office" on a collateral schedule is a homonym, not a category.
What is a medical building worth per square foot in 2026? Nationally, transactions average about $310 per square foot with a broad quality range, against $400 to $560 to build new, which is why existing product keeps trading and pipelines keep shrinking (2)(15)(17).
What cap rate should I underwrite? The national average printed 6.9 percent in Q1 2026; Class A on-campus expectations sit in the 5.5-to-6 range and the best private recapitalizations printed near 6.1 (2)(3)(26). Tenant credit, campus proximity and lease term move the number more than geography does.
Can I get Fannie, Freddie or HUD financing on a medical office building? No. The agencies finance multifamily; HUD's healthcare program covers residential care. Medical office is financed by banks, life companies, CMBS, debt funds and, for owner-occupants, the SBA (27)(28).
What does the SBA actually offer a practice buying its building? Up to 90 percent of project cost through the 504, about 6.2 percent fixed for 25 years as of July 2026, with medical treated as special-purpose property requiring 15 percent equity, 20 for startups, and since July 2026 up to $10 million of combined 504 and 7(a) exposure (28)(29). The loss history behind that structure: 0.74 percent of medical 504 loans charged off since 2010, and 0.24 percent for dentists (1).
Are medical tenants really safer credits? On sixteen years of federal loan tape, yes, by about a third against the whole small-business book, but the spread inside medicine is six to one: veterinary and dental at the safe end, home health and ambulance at the other (1). Underwrite the specialty and the entity, not the word "medical."
Does telehealth threaten the demand case? It settled at about 5.5 percent of claims, two-thirds of it behavioral health (9). Discount square footage for pure talk therapy; everything requiring hands, imaging or an OR came back.
When is a feasibility study actually required? USDA regulations prescribe a five-factor study, economic, market, technical, financial and management, for guaranteed loans, and applications missing a factor get returned (30). On the SBA side, medical's special-purpose designation and going-concern appraisal make an independent study the practical standard for startups, ground-up projects and ASCs, and many lenders now require it as a condition of approval (28).
What kills medical office deals in underwriting? The same five findings, over and over: the seller's property-tax bill instead of the reassessed one; a life-safety occupancy misclassification; rent to a referral source with no FMV opinion in the file; a hospital-tenant rent that assumes provider-based reimbursement survives relocation; and a pipeline check that stopped at the national average (19)(20)(22)(23)(34).
Methodology and Sources
This outlook synthesizes federal statistics, statutes and rulemakings, SEC filings and earnings materials, named industry and brokerage research current through July 2026, and MMCG's proprietary tabulation of SBA loan-level FOIA data covering 84,415 medical-sector loan approvals from FY2010 through March 31, 2026. Figures are cited to their named source and vintage; where providers use different market universes, figures are never blended. Metro figures reflect each named provider's universe and date. Charge-off figures state their denominator. This report is general information for market participants, not legal, tax, investment or lending advice; verify controlling rules with counsel and the responsible agency before relying on them.
MMCG Invest, LLC is a commercial real estate feasibility consultancy. Our bank-ready feasibility studies for medical outpatient buildings, surgery centers, dental and veterinary facilities are relied on by SBA 504 and 7(a) lenders, USDA lenders and conventional credit committees nationwide. For a feasibility study or a fair-market-value rent analysis on a specific site, contact us at mmcginvest.com.
July 31, 2026 Author: Michal Mohelsky, J.D., Principal, MMCG Invest, LLC
Request a Feasibility Study https://calendar.app.google/EJzWEz3GCqLY2jU86

Michal Mohelsky, J.D. | Principal | mmcginvest.com
Contact: michal@mmcginvest.com
Phone: (628) 225-1125
Disclaimer: This report is provided for informational purposes only and does not constitute investment, legal, or tax advice. Data presented herein is derived from proprietary MMCG databases and third-party sources believed to be reliable; however, MMCG Invest makes no representation as to the accuracy or completeness of such information. Figures from third-party industry databases have been independently verified and, where appropriate, adjusted to reflect MMCG's proprietary analytical methodology. Statutory and regulatory references are provided for context and must be verified with counsel before reliance. Past performance is not indicative of future results.
Sources
(1) MMCG Invest, LLC. Proprietary database and tabulation of U.S. Small Business Administration 7(a) and 504 loan-level FOIA data, FY2010 through FY2026 Q2, as of March 31, 2026; MMCG feasibility study archive. (2) CBRE Research. U.S. Medical Outpatient Buildings Figures, Q4 2025 (February 2026) and Q1 2026; U.S. Healthcare Capital Markets reports. (3) CBRE. 2026 U.S. Healthcare Real Estate Investor & Developer Survey, February 2026. (4) CBRE Research. Q1 2026 U.S. Office Figures. (5) Revista. National and top-100-metro medical real estate data, 2Q 2025 vintage, as published in PwC/ULI Emerging Trends in Real Estate 2026 and Revista public releases. (6) Cushman & Wakefield U.S. Office MarketBeat; Moody's Analytics CRE office vacancy series, 2025-2026. (7) U.S. Census Bureau. Older population metro releases (June 27, 2024) and Vintage 2025 population estimates (June 2026); Alliance for Lifetime Income, Peak 65. (8) CDC/NCHS. National Ambulatory Medical Care Survey, 2018 tables, physician office visit rates by age. (9) Centers for Medicare & Medicaid Services. CY2026 OPPS/ASC Final Rule (CMS-1834-FC, November 21, 2025); National Health Expenditure age estimates; Medicare-certified ASC counts; CY2026 Physician Fee Schedule Final Rule. (10) Sg2, a Vizient company. Impact of Change Forecast, 2024 edition. (11) Association of American Medical Colleges. The Complexities of Physician Supply and Demand, 2024 projections; State Physician Workforce Data Report, 2025 (2024 data); HRSA workforce projections. (12) American Medical Association. Physician Practice Benchmark Survey (2024) and Medicare payment trend analyses; Health Sciences Institute DSO data; Gibbins Advisors healthcare bankruptcy reports; industry veterinary visit data (Vetsource/AVMA). (13) Avalere Health for the Physicians Advocacy Institute. Physician Employment Trends study, January 2026 release. (14) MGMA cost and revenue data; dental and veterinary practice-lending underwriting guides (Bank of America Practice Solutions, Live Oak Bank, published benchmarks). (15) JLL. 2026 Medical Outpatient Building Fit-Out Cost Guide, February 11, 2026; JLL 2026 Medical Outpatient Perspective. (16) Turner Construction. Building Cost Index, Q2 2026. (17) Matthews Real Estate Investment Services healthcare construction analyses; Healthcare Real Estate Insights development cost reporting, 2025-2026. (18) Institute of Transportation Engineers. Parking Generation Manual, 5th edition; municipal zoning code survey. (19) National Academy for State Health Policy. 50-State Certificate of Need Scan, updated December 12, 2025; South Carolina Act 20 (2023); Tennessee Public Chapter 985 (2024); North Carolina Session Law 2023-7 and Singleton litigation (December 12, 2025 ruling); Georgia HB 1339 (2024). (20) 42 C.F.R. 411.357(a) (Stark space rental exception); 42 C.F.R. 1001.952(b) (Anti-Kickback space rental safe harbor); Modernizing and Clarifying the Physician Self-Referral Regulations, 85 Fed. Reg. 77492 (December 2, 2020). (21) U.S. Department of Justice press releases and settlement documents: Oklahoma Center for Orthopaedic & Multi-Specialty Surgery ($72.3 million, 2020); Siouxland/Dunes Surgical Hospital ($12.76 million, 2024); HCA ($16.5 million, 2012); BioReference ($10 million); Balance Diagnostics ($2.5 million, S.D.N.Y.). (22) NFPA 101 Life Safety Code; American Society for Health Care Engineering occupancy classification guidance; FGI Guidelines for Design and Construction of Outpatient Facilities. (23) Bipartisan Budget Act of 2015, Section 603; Congressional Research Service, Medicare Site-Neutral Payment (IF13233). (24) Welltower Inc. Form 10-K FY2024 and 2024 Annual Report; Welltower, Remedy Medical Properties and Kayne Anderson Real Estate transaction announcements, October 28, 2025. (25) Healthcare Realty Trust. Q1 2026 earnings release and call (May 2026); Form 10-Q, Q3 2024; FY2025 results (February 12, 2026). (26) Healthpeak Properties. Q1 2026 earnings call transcript (May 6, 2026); Q3 2025 release; Form 10-Q filings. (27) Trepp CMBS delinquency reports (January-March 2026); KBRA CMBS Trend Watch (February 13, 2026); published 2026 lender term sheets for medical office (bank, life company, CMBS); Fannie Mae DUS and Freddie Mac Optigo program eligibility; HUD Section 232 program description. (28) U.S. Small Business Administration. SOP 50 10 8 (effective June 1, 2025); Policy Notice 5000-876441 (effective March 1, 2026); Policy Notice 5000-879058 (effective July 4, 2026); FY2026 fee notices. (29) NADCO and certified development company 504 debenture pricing publications, July 2026. (30) 7 C.F.R. Part 5001, Subpart D and Appendix A (feasibility study requirements); USDA Rural Development Stakeholder Announcement, March 27, 2026 (B&I guarantee increase); USDA Community Facilities program regulations. (31) University of North Carolina Cecil G. Sheps Center rural hospital closures tracker (April 8, 2026); Center for Healthcare Quality and Payment Reform, Rural Hospitals at Risk (January 2026); CMS Rural Health Transformation Program awards (December 29, 2025); CMS Rural Emergency Hospital data. (32) ENERGY STAR Portfolio Manager U.S. National Median Table (August 2024); U.S. EIA Commercial Buildings Energy Consumption Survey, 2018; published HVAC replacement cost benchmarks. (33) Marsh Global Insurance Market Index, Q4 2025 (February 18, 2026) and Q1 2026; Council of Insurance Agents & Brokers Commercial P&C Market Survey, Q1 2026. (34) Transwestern. U.S. Market Medical Office report, Q2 2025 (10,000 SF and larger universe); Cresa medical office metro data as published May 26, 2026. (35) Marcus & Millichap / Institutional Property Advisors. Medical Office National Report, 2H 2025. (36) Congressional Budget Office estimates for P.L. 119-21 (2025-2026); KFF, Status of State Medicaid Expansion Decisions (December 2025) and coverage analyses; U.S. Census Bureau ACS 2024 uninsured rates. (37) Stratmann, T., Bjoerkheim, M., and Koopman, C. Certificate-of-Need Laws and Ambulatory Surgery Centers, Southern Economic Journal 92(1): 63-86 (2025). (38) Health Resources and Services Administration. Health Professional Shortage Area data as of December 31, 2025. (39) Medical Properties Trust Form 8-K (September 26, 2016) and subsequent disclosures; Steward Health Care Chapter 11 record (2024); Massachusetts House Bill 5159 (signed January 8, 2025); The Boston Globe reporting on Steward and MPT.
(c) 2026 MMCG Invest, LLC. Republication with attribution and a link is welcome.


Comments