Summary
An SBA 7(a) RV park acquisition that fails on trailing cash flow can still be the right loan, provided the feasibility study proves the repositioned, tenure-shifted cash flow rather than asserting it. In this composite, a 112-site Southeastern gateway park priced at $4,200,000 carries normalized trailing NOI of $446,000 against annual debt service of approximately $454,000 on a $4,420,000 loan, a 0.98x trailing debt service coverage ratio.
The reposition lifts NOI to $520,000 in Year 1, $610,000 in Year 2 and $686,000 at stabilization in Year 3, a 1.51x DSCR, with indicated stabilized value approaching $7.8 million at an 8.75 percent exit capitalization rate. The demand base supports it: 52.2 million North American camping households in 2025, 24.3 percent above 2019, against net supply growing at roughly one percent per year; the contracted annual and seasonal book carries the loan through the winter and survives the bear case at approximately 1.18x.
Written for SBA 7(a) lenders and credit committees, RV park buyers and operators, Feasibility and appraisal professionals in outdoor hospitality. 23 minute read.
Key figures
- Active North American camping households
- 52.2 million (24.3 percent above 2019)
- Kampgrounds of America, 12th Annual Camping and Outdoor Hospitality Report, April 20262025
- Campers who had difficulty booking a site because campgrounds were full
- 56.1 percent (vs. 10.6 percent in 2019)
- The Dyrt, 2026 Camping Report2024
- Forecast U.S. wholesale RV shipments (median)
- 314,000 units (an 8.2 percent decline)
- RV Industry Association, Summer 2026 RV RoadSigns forecast (ITR Economics)2026 (forecast)
- National median RV nightly rate
- $62
- Insider Perks, 2026 Outdoor Hospitality Pricing Report (609,863 observed price points)2026
- Going-in capitalization rate, Class A and B RV parks
- near 8.0 percent (Class C near 9.0 percent)
- Newmark, 2026 Valuation Advisory North American Market Survey2026
- Trailing debt service coverage ratio (composite subject park)
- 0.98x
- MMCG composite subject park (illustrative), MMCG database, July 2026trailing, July 2026 composite
A lender-grade walkthrough of an SBA 7(a) acquisition-and-reposition mandate in outdoor hospitality, and why the loan that fails on trailing numbers can still be the right loan.
MMCG Invest, LLC | July 2026
1. The Engagement: A Representative Mandate
The mandate that frames this case study is a composite, assembled from recurring fact patterns across MMCG's outdoor hospitality feasibility practice. No single client engagement is described, and no confidential information is disclosed. The numbers are illustrative but calibrated to July 2026 market evidence, all of it cited in the sources section.
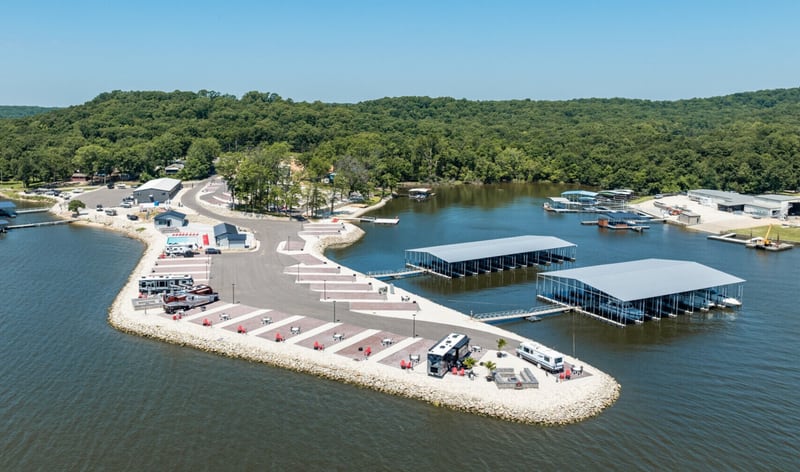
The subject is a 112-site RV park in a Southeastern national-park gateway market: 84 full-hookup RV sites (40 rented on annual agreements, 14 seasonal, 30 transient), 20 water-and-electric sites, and 8 park model cabins, with entitled expansion capacity for 24 additional sites that the transaction does not underwrite. The seller is a retiring couple who built the park two decades ago, run it with unpaid family labor, and have not raised rates in three seasons. The buyer is an experienced hospitality operator acquiring the going concern through an SBA 7(a) change-of-ownership loan that combines the real estate, the business, a reposition capital budget, and working capital in a single facility.
Total project cost is $5,050,000. The proposed structure is an SBA 7(a) loan of $4,420,000 at Prime plus 2.50 percent (9.25 percent at the current 6.75 percent Prime), amortized over 25 years, with a 12.5 percent equity injection of $630,000 , above the 10 percent SOP minimum for a change of ownership.
Here is the fact that decides everything else in this study. Normalized trailing net operating income is approximately $446,000. Annual debt service on the proposed facility is approximately $454,000. The trailing debt service coverage ratio is 0.98x. On historical cash flow alone, this loan does not work. It works, if it works at all, on the repositioned cash flow, and that is precisely the circumstance in which SBA lending practice calls for an independent third-party feasibility study: when the projections the credit depends on exceed what history has demonstrated. This case study walks through what that feasibility study must prove. Coverage looks very different on the storage side of the same demand, and the financial analysis of a purpose-built RV and boat storage facility shows a subject that clears its debt service comfortably.
2. Demand: The Conversion the Shipment Cliff Obscured
The most common analytical error we encounter in RV park credit files is the use of RV wholesale shipments as a proxy for campground demand . Shipments are a manufacturing flow: the number of new units factories deliver to dealers in a year. Campground demand is a function of a stock: the installed base of RVs already on the road, plus the far larger population of camping households that never buys an RV at all. The flow swings violently. The stock barely moves.
The stock, as of the most recent reporting, is at or near record scale. Kampgrounds of America's 12th annual Camping and Outdoor Hospitality Report (April 2026, reporting on calendar 2025) counts 52.2 million active North American camping households, statistically flat against 52.5 million in 2024 and 24.3 percent above the 42.0 million of 2019. The pandemic-era surge of first-time campers largely stuck. The Dyrt's 2026 Camping Report counts 82.4 million individual Americans who camped in 2025, the second-highest total on record. Go RVing's 2025 owner profile counts 8.1 million RV-owning households under a revised methodology, with a further 16.9 million households stating intent to purchase within five years, and reports that median owner usage has risen 50 percent since 2021, from 20 days per year to 30. The Bureau of Economic Analysis (March 2026 release, 2024 data) values RVing at $27.5 billion in value added, the second-largest conventional outdoor recreation activity in a $696.7 billion outdoor economy representing 2.4 percent of GDP.
Two further demand facts matter directly to a credit committee. First, scarcity: The Dyrt reports that 56.1 percent of campers had difficulty booking a site in 2024 because campgrounds were full, up from 10.6 percent in 2019. Excess demand against constrained supply is not a marketing claim in this sector; it is a measured consumer experience. Second, affordability: CBRE's hotel advisory analysis found RV vacations 27 to 62 percent cheaper per day than comparable vacation formats for a family of four, which is the mechanism behind the trade-down resilience the asset class exhibited through prior downturns. A household that cancels a $5,000 fly-and-resort vacation does not necessarily cancel the vacation; it frequently substitutes a $1,500 regional camping trip.
Exhibit 1. The demand stock, July 2026 evidence base
| Indicator | Figure | Source and vintage |
|---|---|---|
| North American camping households, 2025 | 52.2 million (+24.3% vs. 2019) | KOA 12th annual report, Apr 2026 |
| Individual U.S. campers, 2025 | 82.4 million (second-highest ever) | The Dyrt 2026 Camping Report |
| RV-owning households | 8.1 million (revised methodology) | Go RVing 2025 Owner Profile |
| Purchase intenders, five-year horizon | 16.9 million households | Go RVing 2025 Owner Profile |
| Campers unable to book (sold out), 2024 | 56.1%, vs. 10.6% in 2019 | The Dyrt |
| RVing value added, 2024 | $27.5 billion, #2 conventional activity | BEA, Mar 2026 |
| RV trip cost advantage | 27-62% cheaper per day | CBRE Hotels analysis |
- Camping households (M)
- RV shipments (000s)
The numbers behind this chart
| Category | Camping households (M) | RV shipments (000s) |
|---|---|---|
| 2017 | 504.6 | |
| 2018 | 483.7 | |
| 2019 | 42 | 406.1 |
| 2020 | 430.4 | |
| 2021 | 600.2 | |
| 2022 | 58.5 | 493.3 |
| 2023 | 313.2 | |
| 2024 | 52.5 | 333.7 |
| 2025 | 52.2 | 342.2 |
| 2026F | 314 |
3. The Shipment Cliff: What Softened and What It Proved
The shipment record deserves to be stated plainly, because the discipline of this case study depends on not flinching from it. Wholesale shipments peaked at an all-time record of 600,240 units in 2021, fell to 313,174 by 2023, recovered modestly to 333,733 in 2024 and 342,220 in 2025, and are now forecast to fall again. The RV Industry Association's Summer 2026 RoadSigns forecast, prepared by ITR Economics, projects a 2026 median of 314,000 units, an 8.2 percent decline, citing higher financing costs and pressured household budgets. Thor Industries, the largest manufacturer, projects fewer than 300,000 retail registrations. The 2023-2025 run rate of roughly 330,000 units sits about 29 percent below the 2017-2019 pre-pandemic average.
That is a genuine cliff, and it has a genuine campground-side echo: transient softness. Equity LifeStyle Properties reported combined seasonal and transient RV rent down 9.1 percent for full-year 2025. Sun Communities reported transient RV revenue down roughly 10 percent in 2024 and 9 percent in 2025 . Booking-platform data show short-stay transient site-nights down about 2 percent year over year through mid-2026. An honest feasibility study does not model this away.
What the same record proves, however, is the decoupling. Across the identical period in which shipments halved from their peak, camping households held above 52 million, individual campers posted their second-highest total ever, median RV usage per owning household rose 50 percent, and majority-of-campers booking scarcity persisted. And within the REIT disclosures, the tenure split tells the real story: while ELS transient revenue fell, its annual RV base rental income grew 4.1 percent in 2025 and annual streams reached approximately 91 percent of total revenue. Sun's annual RV revenue grew 11 percent in 2024 and 7.5 percent in 2025 even as its transient book shrank, and the company converted more than 2,000 transient sites to annual agreements for the third consecutive year. The shipment cliff is not the campground cliff. It is a manufacturing-cycle correction overlaid on a utilization base that has reset structurally higher, with the volatility concentrated in exactly one revenue tenure: transient.
For underwriting, the conclusion is not "demand is fine." The conclusion is that demand must be decomposed by tenure before it can be underwritten at all, which is the work of Section 5.
Exhibit 2. U.S. wholesale RV shipments, actual and forecast
| Year | Units | Note |
|---|---|---|
| 2017 | 504,599 | Then-record |
| 2018 | 483,672 | |
| 2019 | 406,070 | Pre-pandemic base |
| 2020 | 430,412 | |
| 2021 | 600,240 | All-time record |
| 2022 | 493,268 | |
| 2023 | 313,174 | Trough, -36.5% |
| 2024 | 333,733 | +6.6% |
| 2025 | 342,220 | +2.5%; $20.4B retail value |
| 2026F | 314,000 median | RVIA Summer 2026 RoadSigns, -8.2% (projection) |
The numbers behind this chart
| Category | Series 1 |
|---|---|
| 2017 | 504599 |
| 2018 | 483672 |
| 2019 | 406070 |
| 2020 | 430412 |
| 2021 | 600240 |
| 2022 | 493268 |
| 2023 | 313174 |
| 2024 | 333733 |
| 2025 | 342220 |
| 2026F | 314000 |
4. Supply: The Moat You Cannot Build
If demand has reset higher and shipments are cyclical noise around it, the durable question is supply, and here the evidence is unusually one-sided. The United States has roughly 16,200 private RV parks with more than 1.3 million campsites, alongside roughly 13,000 public campgrounds. Ownership is radically fragmented: approximately 88 percent of facilities are independently owned, REITs hold about 2 percent, and large multi-park operators about 5 percent. Net supply grows at roughly one percent per year. Industry surveys indicate only about 5 percent of operators plan to open a new park in a given year, and the median expansion is approximately eight sites. Florida, one of the most active construction states , added roughly 3,600 sites across 2022-2024, a rounding error against a 1.3-million-site base.
The reasons are physical and legal, and they stack. Entitling a greenfield park typically consumes 24 to 48 months from land control to opening; industry development advisors report rezoning alone routinely exceeding two years, followed by 6 to 18 months of construction and 12 to 24 months of ramp to stabilization. Denials and moratoria are not hypothetical. In the 2023-2026 window alone: Citrus County, Florida commissioners unanimously denied the 149-site Paradise Meadows proposal after the developer had already halved it; Fayette County, Ohio denied an RV park rezoning in June 2026 after a multi-stage battle; Pickens County, South Carolina enacted a six-month moratorium on new RV park and campground applications in February 2026 ; Northport, Maine voters approved a 180-day campground moratorium at their June 2026 town meeting; Montrose County, Colorado stayed new campground special-use permits; Chesterfield County, South Carolina ran a rolling emergency moratorium; and Levy County, Florida signaled that new parks will require centralized sewer and water, effectively closing the rural septic path.
Behind zoning sit the utilities. Wastewater is the most common binding constraint: RV effluent carries higher biological loading than residential sewage, engineered septic requires suitable soils and acreage, and where a municipality mandates a package treatment plant, the cost can exceed one million dollars before a single site earns revenue. Electrical capacity is the second constraint: the industry shift to 50-amp service triples the code-counted load per site relative to legacy 30-amp (12,000 VA versus 3,600 VA under NEC 551.73), and converting even a few dozen sites can force a full service upgrade with utility transformer lead times measured in quarters. Public-sector supply, meanwhile, is contracting in practice: the National Park Service carries a $24.2 billion deferred maintenance backlog (Congressional Research Service, June 2025), 2025 staffing reductions forced campground closures and delayed openings across the system, and the October-November 2025 government shutdown closed federal campgrounds nationwide, all of it pushing overflow demand toward private parks in gateway markets like the subject's.
The underwriting translation is direct. Every one of these barriers is a cost the incumbent has already paid. An entitled, utility-served, 50-amp-capable park in a supply-constrained gateway market holds a franchise that a competitor needs three to four years, uncertain approvals, and seven-figure infrastructure spending to replicate. That franchise, not the pandemic demand spike, is what the lender's collateral actually consists of.
Exhibit 3. The stacked barriers to new supply
| Barrier | Evidence | Effect on incumbents |
|---|---|---|
| Entitlement time | 24-48 months land control to opening; rezoning alone often 2+ years | Multi-year head start on any competitor |
| Denial and moratorium risk | Citrus Co. FL, Fayette Co. OH denials; Pickens Co. SC, Northport ME, Montrose Co. CO, Chesterfield Co. SC moratoria (2023-2026) | Competitor entry is discretionary, and frequently refused |
| Wastewater | Package plants $1M+; engineered septic soil- and acreage-dependent; state permitting | Utility-served capacity is a paid-for scarce asset |
| Electrical | 50-amp sites code-counted at 12,000 VA; conversions can force full service upgrades | Existing 50-amp infrastructure carries replacement-cost value |
| Net supply pace | ~1% annual growth; ~5% of operators expanding; median expansion ~8 sites | Demand growth compounds against a near-fixed base |
| Public campground strain | $24.2B NPS backlog; 2025 closures; record 331.9M park visits (2024) | Overflow demand accrues to private gateway parks |
5. Revenue Architecture: Tenure Is the Balance Sheet
An RV park's income statement is best read as three businesses sharing one address. The transient business is a nightly hotel: the highest rate per occupied night, the widest margins on peak weekends, and full exposure to weather, fuel prices, and consumer sentiment. The seasonal business rents a site for one to six months at a discounted effective rate. The annual business is a subscription: a lower effective nightly rate in exchange for twelve months of contracted, recurring revenue from a guest who has invested in staying. The proportions among the three are not a descriptive detail. They are the credit.
The institutional record makes the point with unusual clarity. Equity LifeStyle Properties derives approximately 91 percent of revenue from annual streams and grew its annual RV base 4.1 percent in 2025 while its seasonal and transient book fell 9.1 percent. Sun Communities has converted more than 2,000 transient sites to annual agreements in each of the last three years, and roughly 70 percent of its RV revenue-producing site gains now come from such conversions. The two most sophisticated owners in the sector are executing the same trade: sell the volatility, keep the subscription. A feasibility study that models a mom-and-pop acquisition should assume the same physics apply at 112 sites that apply at 100,000.
The metric that disciplines the analysis is RevPAS, revenue per available site, the sector's analog to hotel RevPAR : average daily rate multiplied by occupancy. Current platform benchmarks (Campspot with OHI, through May 2025) put blended RevPAS at approximately $12.15 per site-night on a $33 blended ADR, with lodging units (cabins and park models) yielding roughly double the RV-site figure, $26.97 against $13.48. Rate benchmarks frame the reposition: the national median RV nightly rate is $62 (Insider Perks 2026 Pricing Report, 609,863 observed price points), regional medians run from $63.90 in the Southwest to $82.50 in the Northeast, and the MMCG database confirms geography dominates rate, with a 148 percent spread between the cheapest and most expensive states. Full-hookup occupancy benchmarks at 68 percent during operating months (OHI 2023 benchmarking), against roughly 54 percent on a trailing twelve-month basis nationally, a definitional gap Section 6 treats as a failure mode in its own right.
The subject park's trailing profile is the classic under-managed asset. Posted transient rates average $46 against a regional median above $70 for comparable full-hookup gateway product. No dynamic pricing. Ancillary revenue (store, propane, firewood, golf carts, laundry) runs 9 percent of total against a 15 to 25 percent well-run benchmark. The tenure mix is 48 percent annual-and-seasonal by revenue. The reposition thesis is correspondingly conventional, and deliberately modest: normalize rates toward but below regional medians over two seasons ; implement demand-based pricing and credit it far below the 70 to 83 percent revenue differentials the platform vendors report for adopters, since those figures are correlational; convert twelve transient sites to annual agreements, following the REIT playbook; install six additional park models at approximately $45,000 per unit against $145 to $185 median nightly rates for the category; and build ancillary toward 16 percent of revenue. Stabilized Year 3 revenue of $1.44 million against $1.06 million trailing requires no heroic occupancy assumption; it requires executing, at small scale, exactly what the institutional owners have already demonstrated across a decade of disclosures.
6. Seasonality and the Reposition: The Months That Decide the Loan
Annualized figures flatter this asset class, and the flattery has sunk more RV park credits than any demand shock. A gateway park can post a 68 percent operating-months occupancy and a healthy annual coverage ratio while failing to cover debt service for five consecutive months , because the note amortizes in twelve equal installments and the transient revenue arrives in five. The feasibility failure mode is not the average; it is the trough.
MMCG's practice standard is therefore a month-by-month model, and the subject's trailing pattern illustrates why. Roughly 62 percent of transient revenue lands in May through September. The four winter months contribute approximately 14 percent of transient revenue while carrying 33 percent of annual debt service. What bridges the gap is the recurring book: the 40 annual agreements and the winter seasonal contingent produce contracted revenue that covers roughly 55 to 60 percent of every month's debt service before a single transient guest checks in. The reposition raises that floor. Twelve additional annual conversions lift contracted winter coverage materially, and the six new park models, rentable in shoulder months when bare sites are not, flatten the curve from the revenue side. This is the quiet logic of the tenure shift: it is not primarily a revenue-growth strategy, it is a debt-service-coverage-shape strategy.
The occupancy definitions deserve one explicit paragraph , because conflating them is the most common spreadsheet error we correct in third-party projections. Operating-months occupancy (the 68 percent benchmark) excludes closed months. Platform blended occupancy (39.2 percent in the May 2025 Campspot/OHI data) counts all active sites across all days and mixes park types. Trailing-twelve-month occupancy for a seasonal market sits far below peak-month occupancy by construction. A pro forma that applies a 68 percent figure across twelve months has not made an aggressive assumption; it has made a category error, and it will overstate revenue by a third.
7. The Operator and the Asset: Infrastructure and Execution as Underwritten Inputs
Two diligence workstreams decide whether the Section 5 projections are entitled to exist.
The first is physical. The reposition budget allocates $210,000 to convert thirty legacy 30-amp sites to 50-amp service, and the feasibility work must verify, with the serving utility in writing, that transformer and service capacity accommodate the added load within the project timeline, because interconnection lead times are quarters, not weeks. Wastewater capacity must be certified against the stabilized site count, including the six added park models, with headroom documented under the state permit; the record is littered with parks that built first and discovered separation-distance or capacity violations after the fact, including a documented Iowa case in which a completed $65,000 septic field was barred from use entirely. The expansion entitlement for 24 sites is verified and valued as option, not underwritten as cash flow.
The second is financial normalization. Mom-and-pop financials systematically understate true operating cost because owner labor is unpaid. The subject's books show a 38 percent expense ratio; benchmarked against the Newmark RV park expense analysis (62 properties, averaging 53.7 percent of revenue, with payroll at 15.5 percent and utilities at 14.5 percent), MMCG's normalization adds back replacement management at market compensation and a per-site capital reserve, restating the trailing expense ratio to 58 percent and trailing NOI to the $446,000 the underwriting actually uses. The stabilized model then earns its way back to a 52 percent ratio through revenue scale, not cost heroics. The buyer's hospitality track record, the property-management-system implementation plan, and a named contingency operator complete the execution file. A park is a hotel without walls; the SOP's insistence on management capability in change-of-ownership credits is not a formality in this asset class.
8. Capital Markets and the Financing Architecture
The valuation context frames both the entry basis and the exit. Newmark's 2026 Valuation Advisory survey places going-in capitalization rates for Class A and B RV parks near 8.0 percent and Class C near 9.0 percent, a 50 to 150 basis point premium to manufactured housing communities at roughly 5.9 percent and roughly 250 basis points above core multifamily and industrial. Stabilized parks in active markets trade at $15,000 to $40,000 per site, with resort and coastal product at $40,000 to $80,000 and above; securitized comparables in the 2025 CMBS record print at approximately $46,000 to $53,000 per pad. The institutional bid is documented and deep: Blackstone's $5.65 billion all-cash acquisition of Sun's marina platform, Blue Metric's $97 million seven-park portfolio, RREAF's $157 million platform, and a steady procession of family-office and 1031-exchange capital give a stabilized, professionalized park a genuine exit market that did not exist a decade ago.
The subject prices at $4,200,000 against normalized trailing NOI of $446,000: a 10.6 percent going-in capitalization rate and $37,500 per developed site, wide of the Newmark Class C benchmark and inside the stabilized per-site band, which is where an under-managed tertiary asset should price. At a stabilized $686,000 NOI and a conservative 8.75 percent exit capitalization rate , indicated stabilized value approaches $7.8 million, placing the $4.42 million loan below 60 percent of stabilized value, the reversion cushion that compensates the lender for the 0.98x entry coverage.
On the debt side, the structural fact is that the agencies are absent: Fannie Mae and Freddie Mac finance manufactured housing communities robustly and exclude RV resorts explicitly. That absence is why the SBA programs and a handful of specialty lenders constitute the acquisition-financing market for sub-$10 million parks, and why the 7(a) structure here is the market-standard instrument rather than a fallback. The financing menu, as MMCG presents it in feasibility work: a single 7(a) facility to the $5 million program cap, as modeled here, at Prime plus a maximum 3.0 percent spread and up to 25-year amortization for real-estate-majority credits; a 7(a) paired pari passu with conventional debt for larger projects, the structure the specialty SBA lenders run at 85 to 90 percent leverage; or a 504 structure where the real-estate share dominates, with the debenture pricing near 6.2 percent in mid-2026. FY2026 guaranty fees (3.5 percent of the guaranteed portion to $1 million, 3.75 percent above) are capitalized in the uses below.
One arithmetic honesty is owed to the credit committee. At a 10.6 percent going-in capitalization rate against a 10.3 percent loan constant, entry leverage is barely positive, and at Newmark Class C pricing it would be negative. The positive-leverage argument for this asset class is real but it lives in the reposition and the amortization structure, not in the coupon spread at close. That is exactly why the SOP-mandated feasibility study, and not the appraisal alone, carries this file.
Exhibit 4. Sources, uses, and underwriting summary (composite)
| Sources | Uses | ||
|---|---|---|---|
| SBA 7(a) loan (87.5%) | $4,420,000 | Acquisition (going concern) | $4,200,000 |
| Equity injection (12.5%) | $630,000 | Reposition capital budget | $520,000 |
| Working capital | $120,000 | ||
| Guaranty fee, closing, soft costs | $210,000 | ||
| Total | $5,050,000 | Total | $5,050,000 |
| Underwriting metric | Value |
|---|---|
| Rate / amortization | Prime + 2.50% = 9.25% variable / 25 years |
| Annual debt service | ~$454,000 (loan constant 10.3%) |
| Normalized trailing NOI / DSCR | $446,000 / 0.98x |
| Year 1 NOI / DSCR | $520,000 / 1.15x |
| Year 2 NOI / DSCR | $610,000 / 1.34x |
| Stabilized Year 3 NOI / DSCR | $686,000 / 1.51x |
| Going-in cap rate / price per site | 10.6% / $37,500 |
| Stabilized value at 8.75% exit cap | ~$7.8 million (loan < 60% of stabilized value) |
The numbers behind this chart
| Category | Series 1 |
|---|---|
| Trailing | 0.98 |
| Year 1 | 1.15 |
| Year 2 | 1.34 |
| Year 3 | 1.51 |
9. Risk Framework: Tripwires and the Bear Case
A feasibility study that cannot state its own bear case is marketing . Ours is the following: 2026 shipments fall to the Thor scenario below 300,000; fuel prices and consumer softness deepen the transient decline beyond the 9 to 10 percent the REITs printed; Canadian cross-border volume, already down sharply in 2025, stays impaired; and the subject's rate normalization meets resistance in a price-sensitive market. Under that combination, the model's transient revenue line falls roughly 20 percent below plan. The credit survives it, at approximately 1.18x stabilized coverage, for one reason only: the contracted annual and seasonal book, enlarged by the conversions, covers the majority of debt service before transient demand is consulted. A transient-heavy version of this same park, under the same stress, does not survive it. Tenure mix is the risk decision.
Exhibit 5. Tripwires and mitigants
| Risk | Evidence base | Tripwire | Mitigant in structure |
|---|---|---|---|
| Transient demand erosion | ELS seasonal+transient -9.1% (2025); Sun transient -9% to -10% (2024-2025) | Transient revenue >15% below plan for two consecutive seasons | Annual conversions raise contracted coverage floor; dynamic pricing credited conservatively |
| Rate normalization resistance | Regional median $70+ vs. subject $46; price-sensitive cohort data (KOA 2026) | Realized ADR <90% of Year 2 plan | Phased increases at the OHI-median 5% cadence; amenity delivery sequenced ahead of rate |
| Execution / infrastructure | Utility interconnection lead times; wastewater permitting record | 50-amp conversion or permit milestones slip >2 quarters | Written utility capacity confirmation and permit headroom certification as conditions precedent |
| Rate environment | Variable pricing at Prime + 2.50% | Prime +150 bps sustained | Stress case carries coverage at 1.28x stabilized; 504 refinance path documented |
| Climate and insurance | Southeastern exposure; sector premium escalation | Premium >2.5% of revenue | Wind/flood diligence in study; reserve sized in normalization |
| Demand-thesis failure | KOA households <42M (2019 baseline) or Dyrt booking difficulty trending toward ~10% | Multi-year, not single-season | Would signal structural erosion; monitored annually in covenant package |
Outlook: What the Feasibility Study Must Prove
The 2026 setup for RV park credit is, in our judgment, more attractive than the 2021 setup that attracted the tourist capital, precisely because the froth is gone. Shipments are falling, transient revenue is normalizing, and the sellers who priced their parks off pandemic peaks are meeting the market. What remains is the durable architecture: a camping-household base 24 percent above pre-pandemic scale, a supply base growing one percent a year behind three-to-four-year entitlement walls, an institutional buyer pool validating the exit, and a revenue model whose recurring tenure can be deliberately engineered to carry a 25-year amortization schedule through the winter months.
The feasibility study's burden in this environment is specific. It must decompose demand by tenure rather than citing national aggregates. It must model twelve months of debt service against twelve months of seasonal cash flow, not an annualized average. It must normalize mom-and-pop financials to institutional cost reality before computing a single coverage ratio. It must verify utility capacity in writing rather than assuming it. It must credit the reposition levers at a fraction of vendor-reported uplifts. And it must state the trailing coverage plainly, 0.98x in this composite, and then demonstrate, step by auditable step, why the stabilized 1.51x is earned rather than asserted. That is the standard to which this practice holds its own work, because it is the standard on which a credit committee is entitled to insist.
MMCG Invest, LLC is a national commercial real estate feasibility consulting firm serving SBA 7(a), SBA 504, USDA, and conventional lenders across more than thirty asset classes, with an outdoor hospitality practice spanning RV parks, campgrounds, glamping resorts, and marinas. Our studies are prepared for lender reliance and structured to SBA SOP standards. To discuss an RV park or outdoor hospitality mandate , contact us through mmcginvest.com .
Author: Michal Mohelsky, J.D., Principal, MMCG Invest, LLC
Michal Mohelsky, J.D. | Principal | mmcginvest.com
Contact: michal@mmcginvest.com
Phone: (628) 225-1110
Disclaimer: This report is provided for informational purposes only and does not constitute investment advice. Data presented herein is derived from proprietary MMCG databases and third-party sources believed to be reliable; however, MMCG Invest makes no representation as to the accuracy or completeness of such information. Figures from third-party industry databases have been independently verified and, where appropriate, adjusted to reflect MMCG's proprietary analytical methodology. Past performance is not indicative of future results.
Sources
1) Kampgrounds of America, 12th Annual Camping and Outdoor Hospitality Report, April 2026 (2025 data)
2) The Dyrt, 2026 Camping Report, January 2026
3) Go RVing / Ipsos, 2025 RV Owner Demographic Profile
4) RV Industry Association, Summer 2026 RV RoadSigns forecast (ITR Economics), June 2026; historical shipment reports 2017-2025
5) Thor Industries, 2026 outlook commentary
6) U.S. Bureau of Economic Analysis, Outdoor Recreation Economic Statistics, March 2026 release (2024 data)
7) CBRE Hotels Advisory, RV vacation cost comparison studies
8) Equity LifeStyle Properties, FY2024 Form 10-K, FY2025 earnings materials and investor presentation
9) Sun Communities, Inc., FY2024 Form 10-K, FY2025 earnings materials and investor presentations
10) Congressional Research Service, Report R42757, National Park Service deferred maintenance, June 2025
11) National Park Service visitation statistics, calendar 2024
12) Newmark, 2026 Valuation Advisory North American Market Survey (RV park capitalization and discount rates)
13) Newmark, RV Park Expense Analysis (62-property operating benchmark)
14) Campspot / OHI, The Data Dig, May 2025; Campspot year-end platform reviews 2024-2025
15) OHI (Outdoor Hospitality Industry), 2023 Financial and Operational Benchmarking Report
16) Insider Perks, 2026 Outdoor Hospitality Pricing Report, January 2026
17) Local-government and trade-press records of RV park denials and moratoria, 2023-2026 (Citrus County FL; Fayette County OH; Pickens County SC; Northport ME; Montrose County CO; Chesterfield County SC; Levy County FL)
18) U.S. Small Business Administration, SOP 50 10 and FY2026 fee notices; secondary-market pricing references, July 2026
19) Public transaction records and company announcements: Blackstone / Safe Harbor Marinas; Blue Metric Group; RREAF Holdings; CMBS offering documents (BMO 2025-5C12)
20) MMCG database, July 2026

Michal Mohelsky, J.D., FMVA, Practicing Affiliate of the Appraisal Institute
Principal, MMCG Invest, LLC
Published July 16, 2026. How this analysis was prepared.
Cite this
Michal Mohelsky, J.D., FMVA (2026). Feasibility Case Study: Underwriting the RV Park After the Shipment Cliff. MMCG Invest, LLC. https://www.mmcginvest.com/post/feasibility-case-study-underwriting-the-rv-park-after-the-shipment-cliff
Where this goes next
- The MMCG Feasibility Study GlossaryMMCG's feasibility study page for this subject.