Summary
The bottleneck in U.S. oil has moved from the wellhead to the refineries, pipelines and export docks, and the system built to import crude is still adapting to a country that is now the world's largest producer and a growing exporter. Effective operable refining capacity is approximately 18.0 million b/cd across more than 130 facilities, down from the 132 operable refineries and 18.4 million b/cd the country entered 2025 with. The LyondellBasell and Phillips 66 Wilmington closures account for a net loss exceeding 400,000 b/cd, and Valero Benicia removes another 145,000 b/cd.
Crude production set an all-time annual record of 13.586 million b/d in 2025 while the Permian to Corpus Christi corridor has run at 99% utilization since February 2023. Exports fell to 4.0 million b/d in 2025 as shipments to China collapsed 89% year-over-year to roughly 24,000 b/d, and neither licensed deepwater terminal has reached a final investment decision.
Written for Lenders underwriting petroleum supply chain projects, Developers siting fueling, terminal and refining assets, Investors tracking refining and export capacity, Feasibility analysts modeling logistics costs. 18 minute read.
Key figures
- Operable atmospheric distillation capacity
- 18.4 million b/cd
- EIA January 2025 Refinery Capacity ReportJanuary 1, 2025
- U.S. crude oil production, annual record
- 13.586 million b/d
- EIA Short-Term Energy Outlook, March 2026Calendar year 2025
- U.S. crude oil exports
- 4.0 million b/d
- EIA, Annual U.S. crude oil exports decrease for first time since 2021, March 2026Calendar year 2025
- Permian to Corpus Christi pipeline utilization
- 99%
- RBN Energy pipeline capacity and utilization analysesSince February 2023, as of Q1 2026
- Enbridge Mainline throughput record
- 3.1 million b/d
- Enbridge Inc. investor relations and export terminal disclosuresQ3 2025
Updated: Apr 20
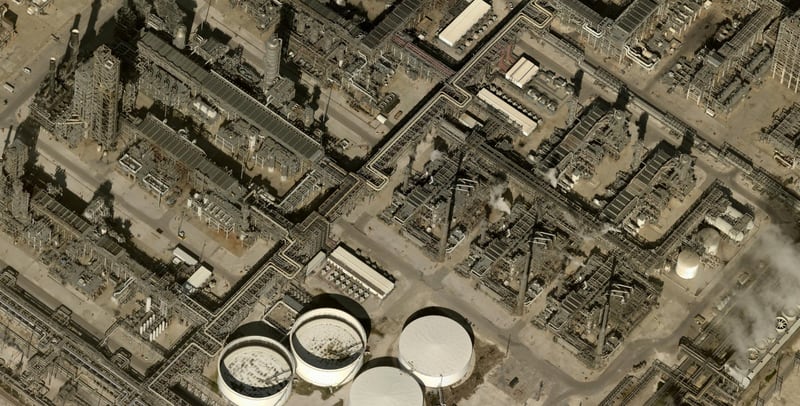
Aerial view of the Motiva Port Arthur refinery complex along Savannah Avenue, capturing the facility's central processing units, interconnected pipe racks, and a cluster of large crude oil storage tanks in the foreground. The image illustrates the scale of the nation's largest single-site refinery operation. Satellite imagery captured by MMCG, January 4, 2026.
The United States operates one of the world’s most complex petroleum logistics networks. As of Q1 2026, the country’s refining base comprises approximately ~18.0 million barrels per calendar day (b/cd) of effective operable capacity across more than 130 facilities, connected by roughly 85,000 to 90,000 miles of crude oil pipelines and a Gulf Coast export complex that shipped a record 4.1 million barrels per day in 2024. Yet this infrastructure is undergoing its most significant transformation in decades. California refineries are shutting down at an accelerating pace. Permian Basin pipelines to Corpus Christi are running at 99% utilization. Proposed deepwater VLCC-loading terminals remain stalled despite federal licensing approvals. And a volatile trade policy landscape, punctuated by the Supreme Court’s February 2026 invalidation of IEEPA tariffs, has reshuffled who buys American crude. With production hitting an all-time record of 13.6 million b/d in 2025, the central tension is clear: the system originally built to import oil is still adapting to the reality of being the world’s largest producer and a growing exporter.
Interactive map of 61 U.S. petroleum refineries, 15 crude oil terminals and inland hubs (including St. James and Cushing), and 33 pipeline systems. Covers approximately 18.0M b/cd refining capacity, 13.6M b/cd domestic production, and 4.1M b/cd crude exports. Layers include capacity tiers (200K+ and sub-200K b/cd), export terminals, import/export hubs, railroad networks, and highway corridors. Facilities validated against operator filings, SEC disclosures, MARAD records, and port authority data. Data as of Q1 2026. Explore our full U.S. oil interactive map, including storage capacities and live pipeline flow.
Refining Capacity Is Contracting for the First Time in Years
The U.S. entered 2025 with 132 operable refineries and 18.4 million b/cd of atmospheric distillation capacity, according to the EIA’s January 2025 Refinery Capacity Report (1). By Q1 2026, effective capacity has dropped to approximately ~18.0 million b/cd following three major closures and one pending shutdown, representing the most significant capacity contraction since the pandemic-era shutdowns of 2020.
The numbers behind this chart
| Category | Series 1 |
|---|---|
| 2015 | 17.97 |
| 2016 | 18.32 |
| 2017 | 18.62 |
| 2018 | 18.6 |
| 2019 | 18.8 |
| 2020 | 18.98 |
| 2021 | 18.13 |
| 2022 | 17.94 |
| 2023 | 18.06 |
| 2024 | 18.38 |
| 2025 | 18.42 |
| 2026e | 18.02 |
Motiva’s Port Arthur refinery (Saudi Aramco, 100%) leads the national ranking at 641,000 b/cd , making it the largest petroleum refinery in the United States by calendar-day capacity. Marathon Petroleum’s Galveston Bay complex in Texas City follows at 631,000 b/cd (665,000 by stream-day measure, making it the largest by that metric). ExxonMobil’s Beaumont refinery , which completed a $2 billion BLADE crude distillation expansion in March 2023 adding 250,000 b/d of light-crude-optimized capacity, ranks third at 612,000 b/cd (3). The Gulf Coast corridor from Beaumont through Houston to Corpus Christi alone accounts for roughly 3.4 million b/cd of capacity across a dozen major facilities.
Three closures and one pending shutdown are reshaping the national refining map. LyondellBasell’s Houston refinery , the city’s oldest facility (built 1918), completed its shutdown in Q1 2025 after seven years on the market without a buyer, removing 264,000 b/cd of capacity (15). The company plans to repurpose portions of the 700-acre site for advanced plastics recycling after 2027. Phillips 66’s Wilmington/Carson complex in Los Angeles ceased crude processing in October 2025, eliminating 139,000 b/cd , approximately 8% of California’s remaining refining base (16). The dual-site facility is slated for mixed-use redevelopment as the Five Points Union Project, though extensive contamination including PFAS and benzene in groundwater will complicate the transition. Phillips 66 estimated $205 million in infrastructure removal costs alone. Valero’s Benicia refinery (145,000 b/cd) in the San Francisco Bay Area filed notice to cease operations by end of April 2026, triggering a $1.1 billion pre-tax impairment charge for Valero’s California operations (17).
California’s refining capacity has now declined from 2.5 million b/d in 1984 to roughly 1.3 million by mid-2026, a structural contraction driven by tightening regulations including the AB-1 Energy law, declining in-state crude production (down approximately 75% from peak levels), and the state’s aggressive EV adoption targets. Meanwhile, Phillips 66 acquired Cenovus Energy’s 50% stake in the Wood River refinery (Roxana, IL, 345,000 b/cd) and Borger refinery (Borger, TX, 150,000 b/cd) for $1.4 billion in September 2025, consolidating full ownership of both facilities (25).
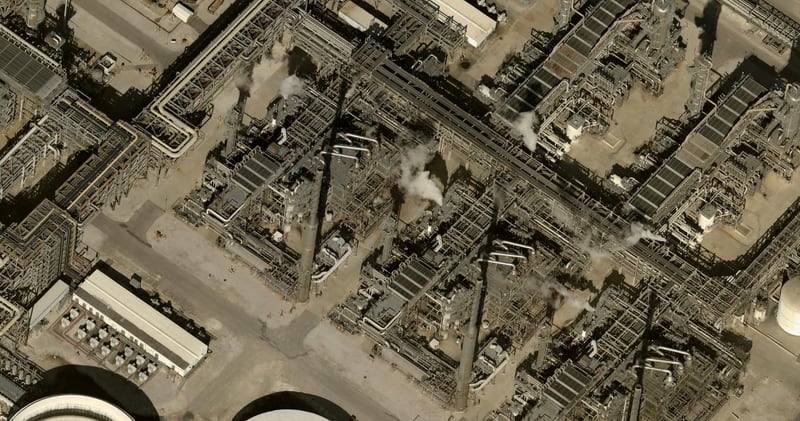
Close-up aerial of the refinery's distillation towers, catalytic cracking units, and associated heat exchange infrastructure during active operations, with visible steam emissions indicating real-time throughput across multiple processing trains. Satellite imagery captured by MMCG, January 4, 2026.
On the expansion side, the only major recent addition was ExxonMobil’s Beaumont BLADE project, the largest U.S. refinery expansion in over a decade. A Texas startup rebranded as America First Refining has proposed a new 160,000 b/d greenfield refinery, which would be the first major new petroleum refinery built in the U.S. since Marathon’s Garyville facility came online in 1977, though its completion remains speculative (18). Refinery utilization averaged 90.6% in 2024 and spiked to 95.5% during the week of July 18, 2025, the highest level since June 2023.
| Rank | Facility | Operator | Location | Cap (K b/cd) | Status |
|---|---|---|---|---|---|
| 1 | Motiva Port Arthur | Motiva (Saudi Aramco) | Port Arthur, TX | 641 | Operating |
| 2 | Marathon Galveston Bay | Marathon Petroleum | Texas City, TX | 631 | Operating |
| 3 | ExxonMobil Beaumont | ExxonMobil | Beaumont, TX | 612 | Operating |
| 4 | Marathon Garyville | Marathon Petroleum | Garyville, LA | 606 | Operating |
| 5 | ExxonMobil Baytown | ExxonMobil | Baytown, TX | 564 | Operating |
| 6 | ExxonMobil Baton Rouge | ExxonMobil | Baton Rouge, LA | 523 | Operating |
| 7 | Citgo Lake Charles | Citgo (PDVSA) | Lake Charles, LA | 460 | Operating |
| 8 | BP Whiting | BP | Whiting, IN | 435 | Operating |
| 9 | Valero Port Arthur | Valero | Port Arthur, TX | 380 | Operating |
| 10 | Marathon Los Angeles | Marathon (Tesoro) | Carson, CA | 365 | Operating |
| 11 | Flint Hills CC | Flint Hills (Koch) | Corpus Christi, TX | 356 | Operating |
| 12 | Chevron Pascagoula | Chevron | Pascagoula, MS | 356 | Operating |
| 13 | Phillips 66 Wood River | Phillips 66 (100%) | Roxana, IL | 345 | Operating |
| 14 | Flint Hills Pine Bend | Flint Hills (Koch) | Rosemount, MN | 335 | Operating |
| 15 | Pemex Deer Park | Pemex | Deer Park, TX | 313 | Operating |
Source: MMCG proprietary database, EIA Refinery Capacity Report (January 1, 2025). Capacity = atmospheric crude oil distillation. Combined facilities shown as aggregate.
Permian Pipelines Are Nearly Full, and the Bottleneck Is Returning
The roughly 85,000 to 90,000 miles of U.S. crude oil pipelines (per PHMSA data) form the circulatory system connecting production basins to refineries and export terminals (14). Nowhere is this system under more stress than in the Permian Basin, which produced an estimated 6.6 million b/d in 2025, nearly half of all U.S. output. According to the MMCG database, 33 major crude oil pipeline systems currently operate across the United States, organized into seven distinct corridor categories.
The Permian-to-Corpus Christi corridor , served by three major pipelines (Gray Oak, EPIC Crude, and Cactus II), is effectively full at 99% utilization since February 2023 (11). Gray Oak (Enbridge 58.5%, Phillips 66, Marathon, Diamondback), the corridor’s largest line at 980,000 b/d after completing an 80,000 b/d expansion in Q1 2025, has operated at 104% of its original nameplate capacity. EPIC Crude (Plains All American, 100% since 2025) runs at its full 600,000 b/d capacity, while Cactus II (Plains 70%, Enbridge 30%) operates at or near its 670,000 b/d limit. Combined corridor throughput approaches 2.25 million b/d.
The Permian-to-Houston corridor carries approximately 3.3 million b/d through four systems. The Wink-to-Webster system (ExxonMobil, Plains, MPLX, Delek), the basin’s largest single pipeline at 1.5 million b/d design capacity, pushed through approximately 1.35 million b/d in early 2026. Enterprise Products’ Midland-to-ECHO system delivers a combined 1.07 million b/d into the ECHO terminal, the ICE WTI Midland (HOU) futures delivery point. BridgeTex (ONEOK 30%, OMERS 50%, Plains 20%; 440,000 b/d) and Longhorn (ONEOK; 275,000 b/d) complete the corridor. The Permian Express system (Energy Transfer 85%, ExxonMobil 15%; 600,000 b/d) routes crude to Nederland, Texas, but operates at only about 50% utilization as shippers prefer Corpus Christi and Houston.
The Enbridge Mainline: North America’s Largest Crude Pipeline System
The Enbridge Mainline/Lakehead system is the most important crude pipeline network on the continent, carrying a record 3.1 million b/d in Q3 2025 from Alberta to U.S. Midwest refineries and onward (7). The U.S. portion spans approximately 1,900 miles. Enbridge Line 61 (Southern Access) , at 1.2 million b/d through a 42-inch pipe from Superior, Wisconsin to Flanagan, Illinois, is the single largest crude oil pipeline in the United States by capacity. Flanagan South (700,000 b/d, with an additional 100,000 b/d expansion approved November 2025) continues the corridor to Cushing. Enbridge Line 5 (540,000 b/d) from Superior through Michigan’s Upper Peninsula to Sarnia remains among the most controversial pipeline assets in the country, with a Bad River reroute under construction as of March 2026.
Rocky Mountain and DJ Basin crude reaches Cushing via Tallgrass Energy’s Pony Express (320,000 to 400,000 b/d from Guernsey, Wyoming), the Saddlehorn/Grand Mesa shared mainline (combined 440,000 b/d from Colorado), and the White Cliffs pipeline (approximately 100,000 b/d on the remaining crude line). Bakken production moves primarily through DAPL at 750,000 b/d (Army Corps final EIS recommending continued operation published December 2025), with the Butte Pipeline (True Companies, up to 160,000 b/d) aggregating Montana/North Dakota volumes.
On the regulatory front, FERC in November 2025 proposed tightening the oil pipeline rate index to PPI-FG minus 1.42% for the five-year period beginning July 2026, a significant decrease from the current PPI-FG plus 0.78%, which would constrain pipeline operators’ ability to raise tariffs (13). Meanwhile, the Trump administration eliminated GHG analysis requirements for pipeline certifications and rescinded several Obama- and Biden-era environmental review policies, streamlining permitting for new infrastructure.
| Corridor | # | Key Pipelines | Combined Cap | Utilization |
|---|---|---|---|---|
| Permian → Corpus Christi | 3 | Gray Oak, EPIC, Cactus II | 2.25M b/d | ~99% |
| Permian → Houston | 4 | W2W, M2E, BridgeTex, Longhorn | 3.3M b/d | ~85-91% |
| Permian → Nederland | 1 | Permian Express (PE1-PE4) | 600K b/d | ~50% |
| Permian → Cushing | 2 | Basin, Centurion | 0.6-1.0M b/d | ~35-50% |
| Enbridge / Canadian | 6 | Line 61, Flanagan S, Spearhead, Line 5, Platte, Trans Mtn | 3.0M+ b/d | Record |
| Rocky Mtn / DJ Basin | 3 | Pony Express, Saddlehorn/Grand Mesa, White Cliffs | ~860K b/d | ~60-85% |
| Bakken | 2 | DAPL, Butte | 910K b/d | ~65-80% |
| Keystone | 1 | Keystone Phase III (+ Houston Lateral) | 700K b/d | ~80-90% |
| Mid-Continent | 5 | Seaway, Capline, Ozark, Diamond, Cushing Connect | 1.77M b/d | Varies |
| Gulf Coast Connectors | 5 | ETCOP, W TX Gulf, Mid-Valley, Bayou Bridge, KS Lat | 1.84M b/d | Varies |
| Refined Products | 1 | Colonial Pipeline | 2.5M b/d | ~85% |
Source: MMCG proprietary database, operator filings, RBN Energy, Global Energy Monitor, FERC. 33 systems total.
The Gulf Coast Export Machine and Deepwater Ambitions
Corpus Christi has cemented its position as the world’s third-largest crude oil export port , handling approximately 60% of all U.S. crude exports at roughly 2.2 to 2.4 million b/d in early 2026. The port’s Ship Channel Improvement Project reached substantial completion in 2025, deepening the channel to 54 feet and widening it to 530 feet.
The Enbridge Ingleside Energy Center is the single most important U.S. crude export facility, handling approximately 25% of Gulf Coast crude exports and having loaded over 500 VLCCs since 2018 (7). The facility, acquired from Moda Midstream for $3 billion in 2021, features three VLCC-capable berths augmented by docks acquired from Flint Hills Resources for approximately $200 million in 2023, with storage expanding from 17.6 million barrels to approximately 20.1 million under a Phase VII construction program. Gibson Energy’s South Texas Gateway (acquired for $1.1 billion in August 2023, giving Gibson 100% ownership) ranks second at 800,000 b/d with permitted capacity to 1 million b/d (22).
Houston’s 45-foot draft channel limits vessels to Suezmax class, but the area’s enormous storage capacity exceeds 60 million barrels. Enterprise Products’ Hydrocarbons Terminal (EHT) leads with a nameplate capacity of 2.75 million b/d of crude throughput (8). The ECHO terminal (Enterprise, 9.0 million barrels) and ONEOK East Houston (formerly Magellan, 20 million barrels, acquired via $18.8 billion merger in September 2023) serve as inland pipeline hubs and ICE futures delivery points (23). Energy Transfer’s Nederland Terminal , with 33 million barrels across 84 tanks , is the largest single-owner above-ground crude storage facility in the United States (9).
LOOP (Louisiana Offshore Oil Port) remains the only operational U.S. facility capable of fully loading VLCCs. Its three single-point mooring buoys and 72+ million barrels of salt-cavern storage connect via the 54-mile LOCAP pipeline to St. James, Louisiana , a major inland crude hub with aggregate storage exceeding 18 million barrels. Cushing, Oklahoma , the NYMEX WTI futures delivery point, maintains aggregate tank storage of approximately 91 to 100 million barrels across operators including Plains (27.2 million), Enbridge (20.1 million), and ONEOK (7.8 million), but has no marine access.
Enterprise’s SPOT terminal received MARAD’s first deepwater crude export license in April 2024, and Texas GulfLink received its license in January 2026. However, neither has reached a final investment decision. Enterprise acknowledged insufficient customer commitments, and anchor customer Chevron withdrew. Analysts suggest the earliest possible construction restart is 2027 at the earliest.
| Terminal / Hub | Operator | Throughput | Storage (MMbbl) | VLCC | Type |
|---|---|---|---|---|---|
| Enterprise EHT | Enterprise Products | 2.75M b/d | 40 | No | Export |
| Enbridge Ingleside | Enbridge | 1.6M b/d | 17.6 | Yes | Export |
| Nederland Terminal | Energy Transfer | 2.0M b/d | 33 | No | Imp/Exp |
| ONEOK East Houston | ONEOK | 1.5M b/d | 20 | No | Hub |
| LOOP | MPLX/Shell/Valero | 1.2M b/d | 72+ | Yes | Imp/Exp |
| S TX Gateway | Gibson Energy | 800K b/d | 8.6 | Partial | Export |
| ET HFOTCO | Energy Transfer | 800K b/d | 19.1 | No | Imp/Exp |
| Cushing Hub | Multiple | Inland hub | 91-100 | No | Hub |
| Seabrook Logistics | ONEOK/LBC | 700K b/d | 4.0 | No | Export |
| ECHO Terminal | Enterprise | 1.0M b/d | 9.0 | No | Hub |
| St. James Hub | Multiple | Inland hub | 18+ | No | Hub |
| Sunoco CC (fka NuStar) | Sunoco LP | 400K b/d | 3.9 | No | Export |
| Buckeye TX Partners | Buckeye/Trafigura | 400K b/d | 7.0 | No | Imp/Exp |
Source: MMCG proprietary database, operator filings, SEC disclosures, MARAD, port authority data. NuStar acquired by Sunoco LP May 2024 ($7.3B) (24).
Trade Flows Reshaped by Tariffs, Sanctions, and Geopolitics
U.S. crude exports declined to 4.0 million b/d in 2025, a 3% drop and the first annual decrease since 2021 (5). The decline masked dramatic shifts in destination: exports to China collapsed 89% year-over-year to roughly 24,000 b/d as Beijing’s retaliatory tariffs reached 125% before de-escalating. India gained approximately 90,000 b/d , while Nigeria surged from 40,000 to 110,000 b/d as the Dangote refinery ramped. The Netherlands remained the top single destination at approximately 900,000 b/d via Rotterdam.
The trade policy environment was exceptionally turbulent. The administration imposed IEEPA-based tariffs in February 2025 including 10% on Canadian energy and 25% on Mexican energy , estimated to cost roughly $6.5 billion annually. The Supreme Court struck down all IEEPA tariffs in February 2026 in Learning Resources, Inc. v. Trump (19); the administration pivoted to Section 122 authority imposing 10% tariffs for 150 days.
Despite being the world’s largest producer, the U.S. remains a net importer of crude oil . Net crude imports fell to 2.2 million b/d in 2025, the lowest since 1971. Canada supplied roughly 60% of crude imports (a record 4.7 million b/d in 2024, boosted by the Trans Mountain expansion to 890,000 b/d completed May 2024), reflecting the structural reality that over 70% of U.S. refineries are configured for heavy/sour crude that American shale fields do not produce. Russian sanctions eliminated roughly 670,000 b/d of former U.S. petroleum imports and drove U.S. exports to Europe from about 1 million b/d to 1.93 million b/d by 2024 (4).
Record Production, Depleted Reserves, and a Shifting Outlook
U.S. crude production hit an all-time annual record of 13.586 million b/d in 2025, with a monthly peak of 13.642 million b/d in July (2). PADD 3 (Gulf Coast) dominated at 73.6% of national output. New Mexico added 221,000 b/d (+10.9%) as Delaware Basin development accelerated, doubling production since 2019 to 2.244 million b/d. Federal Offshore Gulf of Mexico rebounded to 1.9 million b/d. California continued structural decline, falling 43,000 b/d to just 257,000 b/d (3).
Record production was achieved despite a declining rig count, with Baker Hughes data showing U.S. oil rigs at roughly 414 in March 2026, down from about 500 two years earlier. Longer lateral wells, AI-driven drilling optimization, and concentration on the most productive zones have severed the traditional link between rig counts and output.
The Strategic Petroleum Reserve held 415.4 million barrels as of March 20, 2026, roughly 57.5% of its 714 million barrel capacity. The March 2026 Iran crisis triggered an emergency exchange of 45.2 million barrels, part of the IEA’s largest-ever coordinated release of 412 million barrels from 32 countries (20). EIA’s March 2026 STEO projects 13.8 million b/d of production in 2027 as elevated prices above $90/barrel incentivize drilling (2).
Exhibit 4: U.S. Crude Oil Production by PADD Region (2025)
| PADD Region | Production (M b/d) | Share | Key Basins |
|---|---|---|---|
| PADD 3 (Gulf Coast) | 10.00 | 73.6% | Permian (TX/NM), Eagle Ford, GOM |
| PADD 2 (Midwest) | 1.60 | 11.8% | Bakken (ND), Niobrara (CO) |
| PADD 5 (West Coast) | 1.15 | 8.5% | Alaska North Slope, CA basins |
| PADD 4 (Rockies) | 0.55 | 4.0% | DJ Basin (CO), Powder River (WY) |
| PADD 1 (East Coast) | 0.04 | 0.3% | Appalachian (minor) |
| GOM Offshore | 1.90 | (in PADD 3) | Deepwater Gulf of Mexico |
| U.S. TOTAL | 13.59 | 100% |
Source: MMCG proprietary database, EIA production data. GOM Offshore is a subset of PADD 3.
Infrastructure Investment Lags the Production Revolution
The overarching story of U.S. oil infrastructure in 2025 and 2026 is one of a system still catching up to the shale revolution. Production keeps setting records while refining capacity contracts, with a net loss exceeding 400,000 b/cd from the LyondellBasell and Phillips 66 Wilmington closures , and Valero Benicia adding another 145,000 b/cd. The Permian’s pipeline network to Corpus Christi is at 99% utilization, and no new greenfield crude oil pipeline to the Gulf Coast is under active development.
The most consequential infrastructure decision ahead is whether Enterprise’s SPOT and Texas GulfLink deepwater terminals actually get built. Their viability will determine whether the U.S. can efficiently scale crude exports beyond 4 to 5 million b/d without prohibitive lightering costs. Meanwhile, the trade policy whiplash of 2025, with IEEPA tariffs imposed, escalated, and then struck down by the Supreme Court, demonstrated how quickly political decisions can reroute physical flows, as the 89% collapse in crude exports to China vividly illustrated.
For investors, lenders, and developers evaluating petroleum supply chain projects, the infrastructure map reveals both risk and opportunity. The Gulf Coast corridor from Beaumont through Houston to Corpus Christi concentrates over 75% of the nation’s major refinery capacity, every significant export terminal, and the terminus of nearly every Permian pipeline. This geographic concentration delivers extraordinary efficiency but also creates systemic vulnerability, as the 2021 Colonial Pipeline ransomware attack and recurring hurricane disruptions demonstrate. Facilities positioned along these corridors benefit from deep infrastructure connectivity; those outside them face structurally higher logistics costs that feasibility models must capture.
March 30, 2026, by Michal Mohelsky, J.D., principal of MMCG Invest, LLC
About MMCG
MMCG Invest, LLC provides independent, third-party feasibility studies for SBA and USDA guaranteed loan programs across all commercial real estate asset classes, including petroleum infrastructure, refinery facilities, and fueling stations. Our studies meet the analytical rigor required by leading government-guaranteed lenders and USDA. For more information, contact our team directly.
Interest in discussing market conditions for your oil infrastructure project?
Michal Mohelsky, J.D. | Principal | mmcginvest.com
Contact: michal@mmcginvest.com
Phone: (628) 225-1110
Disclaimer: This report is provided for informational purposes only and does not constitute investment advice. Data presented herein is derived from proprietary MMCG databases and third-party sources believed to be reliable; however, MMCG Invest makes no representation as to the accuracy or completeness of such information. Figures from third-party industry databases have been independently verified and, where appropriate, adjusted to reflect MMCG's proprietary analytical methodology. Past performance is not indicative of future results.
Sources
(1) U.S. Energy Information Administration, Refinery Capacity Report, January 1, 2025.
(2) EIA, Short-Term Energy Outlook, March 2026.
(3) EIA, Crude Oil Production data, 2025.
(4) EIA, "U.S. crude oil exports reached a new record in 2024," April 2025.
(5) EIA, "Annual U.S. crude oil exports decrease for first time since 2021," March 2026.
(6) MMCG proprietary database (capacity, throughput, infrastructure figures adjusted from industry sources).
(7) Enbridge Inc., Investor Relations and Export Terminal disclosures, 2024-2026.
(8) Enterprise Products Partners, SEC filings and investor presentations, 2024-2026.
(9) Energy Transfer LP, Crude Oil segment disclosures and investor presentations.
(10) Plains All American Pipeline, LP, Annual Reports and FERC filings.
(11) RBN Energy, pipeline capacity and utilization analyses, 2024-2026.
(12) Global Energy Monitor, pipeline and terminal databases.
(13) FERC, Oil Pipeline Index rulemaking, November 2025.
(14) PHMSA, Pipeline mileage and safety data.
(15) Hydrocarbon Processing, LyondellBasell Houston refinery shutdown, February 2025.
(16) S&P Global, Phillips 66 Wilmington closure, October 2024.
(17) Valero Energy Corp., California Energy Commission filing re: Benicia refinery.
(18) Fortune, "Trump says the U.S. will open its first new oil refinery in nearly 50 years," March 2026.
(19) SCOTUSblog, "Supreme Court strikes down tariffs," February 2026.
(20) NPR, "Countries agree to a historic release of stockpiled oil," March 2026.
(21) Inspectioneering, "U.S. Exports Record Amount of Crude Oil in 2024," April 2025.
(22) Gibson Energy, South Texas Gateway acquisition, August 2023.
(23) ONEOK, Magellan Midstream Partners merger closing, September 2023.
(24) Sunoco LP, NuStar Energy acquisition closing, May 2024.
(25) Phillips 66, Wood River/Borger JV acquisition from Cenovus, September 2025.

Michal Mohelsky, J.D., FMVA, Practicing Affiliate of the Appraisal Institute
Principal, MMCG Invest, LLC
Published March 30, 2026. Last updated April 20, 2026. How this analysis was prepared.
Cite this
Michal Mohelsky, J.D., FMVA (2026). America’s Oil Infrastructure at a Crossroads. MMCG Invest, LLC. https://www.mmcginvest.com/post/america-s-oil-infrastructure-at-a-crossroads
Where this leads
Where this goes next
- USDA Feasibility StudyMMCG's feasibility study page for this subject.